A Data Engineer is responsible for building and maintaining the systems that allow data to be collected, stored, transformed, and delivered reliably for analytics and downstream use cases. While Data Analysts focus on insights and decision-making, Data Engineers focus on making data available, trustworthy, and scalable.
In many organizations, nothing in analytics works well without strong data engineering underneath it.
The Core Purpose of a Data Engineer
At its core, the role of a Data Engineer is to:
Design and build data pipelines
Ensure data is reliable, timely, and accessible
Create the foundation that enables analytics, reporting, and data science
Data Engineers make sure that when someone asks a question of the data, the data is actually there—and correct.
Typical Responsibilities of a Data Engineer
While the exact responsibilities vary by company size and maturity, most Data Engineers spend time across the following areas.
Ingesting Data from Source Systems
Data Engineers build processes to ingest data from:
Operational databases
SaaS applications
APIs and event streams
Files and external data sources
This ingestion can be batch-based, streaming, or a mix of both, depending on the business needs.
Building and Maintaining Data Pipelines
Once data is ingested, Data Engineers:
Transform raw data into usable formats
Handle schema changes and data drift
Manage dependencies and scheduling
Monitor pipelines for failures and performance issues
Pipelines must be repeatable, resilient, and observable.
Managing Data Storage and Platforms
Data Engineers design and maintain:
Data warehouses and lakehouses
Data lakes and object storage
Partitioning, indexing, and performance strategies
They balance cost, performance, scalability, and ease of use while aligning with organizational standards.
Ensuring Data Quality and Reliability
A key responsibility is ensuring data can be trusted. This includes:
Validating data completeness and accuracy
Detecting anomalies or missing data
Implementing data quality checks and alerts
Supporting SLAs for data freshness
Reliable data is not accidental—it is engineered.
Enabling Analytics and Downstream Use Cases
Data Engineers work closely with:
Data Analysts and BI developers
Analytics engineers
Data scientists and ML engineers
They ensure datasets are structured in a way that supports efficient querying, consistent metrics, and self-service analytics.
Common Tools Used by Data Engineers
The exact toolset varies, but Data Engineers often work with:
Databases & Warehouses (e.g., cloud data platforms)
ETL / ELT Tools and orchestration frameworks
SQL for transformations and validation
Programming Languages such as Python, Java, or Scala
Streaming Technologies for real-time data
Infrastructure & Cloud Platforms
Monitoring and Observability Tools
Tooling matters, but design decisions matter more.
What a Data Engineer Is Not
Understanding role boundaries helps teams work effectively.
A Data Engineer is typically not:
A report or dashboard builder
A business stakeholder defining KPIs
A data scientist focused on modeling and experimentation
A system administrator managing only infrastructure
That said, in smaller teams, Data Engineers may wear multiple hats.
What the Role Looks Like Day-to-Day
A typical day for a Data Engineer might include:
Investigating a failed pipeline or delayed data load
Updating transformations to accommodate schema changes
Optimizing a slow query or job
Reviewing data quality alerts
Coordinating with analysts on new data needs
Deploying pipeline updates
Much of the work is preventative—ensuring problems don’t happen later.
How the Role Evolves Over Time
As organizations mature, the Data Engineer role evolves:
From manual ETL → automated, scalable pipelines
From siloed systems → centralized platforms
From reactive fixes → proactive reliability engineering
From data movement → data platform architecture
Senior Data Engineers often influence platform strategy, standards, and long-term technical direction.
Why Data Engineers Are So Important
Data Engineers are critical because:
They prevent analytics from becoming fragile or inconsistent
They enable speed without sacrificing trust
They scale data usage across the organization
They reduce technical debt and operational risk
Without strong data engineering, analytics becomes slow, unreliable, and difficult to scale.
Final Thoughts
A Data Engineer’s job is not just moving data from one place to another. It is about designing systems that make data dependable, usable, and sustainable.
When Data Engineers do their job well, everyone downstream—from analysts to executives—can focus on asking better questions instead of questioning the data itself.
A Data Scientist focuses on using statistical analysis, experimentation, and machine learning to understand complex problems and make predictions about what is likely to happen next. While Data Analysts often explain what has already happened, and Data Engineers build the systems that deliver data, Data Scientists explore patterns, probabilities, and future outcomes.
At their best, Data Scientists help organizations move from descriptive insights to predictive and prescriptive decision-making.
The Core Purpose of a Data Scientist
At its core, the role of a Data Scientist is to:
Explore complex and ambiguous problems using data
Build models that explain or predict outcomes
Quantify uncertainty and risk
Inform decisions with probabilistic insights
Data Scientists are not just model builders—they are problem solvers who apply scientific thinking to business questions.
Typical Responsibilities of a Data Scientist
While responsibilities vary by organization and maturity, most Data Scientists work across the following areas.
Framing the Problem and Defining Success
Data Scientists work with stakeholders to:
Clarify the business objective
Determine whether a data science approach is appropriate
Define measurable success criteria
Identify constraints and assumptions
A key skill is knowing when not to use machine learning.
Exploring and Understanding Data
Before modeling begins, Data Scientists:
Perform exploratory data analysis (EDA)
Investigate distributions, correlations, and outliers
Identify data gaps and biases
Assess data quality and suitability for modeling
This phase often determines whether a project succeeds or fails.
Feature Engineering and Data Preparation
Transforming raw data into meaningful inputs is a major part of the job:
Creating features that capture real-world behavior
Encoding categorical variables
Handling missing or noisy data
Scaling and normalizing data where needed
Good features often matter more than complex models.
Building and Evaluating Models
Data Scientists develop and test models such as:
Regression and classification models
Time-series forecasting models
Clustering and segmentation techniques
Anomaly detection systems
They evaluate models using appropriate metrics and validation techniques, balancing accuracy with interpretability and robustness.
Communicating Results and Recommendations
A critical responsibility is explaining:
What the model does and does not do
How confident the predictions are
What trade-offs exist
How results should be used in decision-making
A model that cannot be understood or trusted will rarely be adopted.
Common Tools Used by Data Scientists
While toolsets vary, Data Scientists commonly use:
Programming Languages such as Python or R
Statistical & ML Libraries (e.g., scikit-learn, TensorFlow, PyTorch)
SQL for data access and exploration
Notebooks for experimentation and analysis
Visualization Libraries for data exploration
Version Control for reproducibility
The emphasis is on experimentation, iteration, and learning.
What a Data Scientist Is Not
Clarifying misconceptions is important.
A Data Scientist is typically not:
A report or dashboard developer
A data engineer focused on pipelines and infrastructure
An AI product that automatically solves business problems
A decision-maker replacing human judgment
In practice, Data Scientists collaborate closely with analysts, engineers, and business leaders.
What the Role Looks Like Day-to-Day
A typical day for a Data Scientist may include:
Exploring a new dataset or feature
Testing model assumptions
Running experiments and comparing results
Reviewing model performance
Discussing findings with stakeholders
Iterating based on feedback or new data
Much of the work is exploratory and non-linear.
How the Role Evolves Over Time
As organizations mature, the Data Scientist role often evolves:
From ad-hoc modeling → repeatable experimentation
From isolated analysis → productionized models
From accuracy-focused → impact-focused outcomes
From individual contributor → technical or domain expert
Senior Data Scientists often guide model strategy, ethics, and best practices.
Why Data Scientists Are So Important
Data Scientists add value by:
Quantifying uncertainty and risk
Anticipating future outcomes
Enabling proactive decision-making
Supporting innovation through experimentation
They help organizations move beyond hindsight and into foresight.
Final Thoughts
A Data Scientist’s job is not simply to build complex models—it is to apply scientific thinking to messy, real-world problems using data.
When Data Scientists succeed, their work informs smarter decisions, better products, and more resilient strategies—always in partnership with engineering, analytics, and the business.
The role of a Data Analyst is often discussed, frequently hired for, and sometimes misunderstood. While job titles and responsibilities can vary by organization, the core purpose of a Data Analyst is consistent: to turn data into insight that supports better decisions.
Data Analysts sit at the intersection of business questions, data systems, and analytical thinking. They help organizations understand what is happening, why it is happening, and what actions should be taken as a result.
The Core Purpose of a Data Analyst
At its heart, a Data Analyst’s job is to:
Translate business questions into analytical problems
Explore and analyze data to uncover patterns and trends
Communicate findings in a way that drives understanding and action
Data Analysts do not simply produce reports—they provide context, interpretation, and clarity around data.
Typical Responsibilities of a Data Analyst
While responsibilities vary by industry and maturity level, most Data Analysts spend time across the following areas.
Understanding the Business Problem
A Data Analyst works closely with stakeholders to understand:
What decision needs to be made
What success looks like
Which metrics actually matter
This step is critical. Poorly defined questions lead to misleading analysis, no matter how good the data is.
Accessing, Cleaning, and Preparing Data
Before analysis can begin, data must be usable. This often includes:
Querying data from databases or data warehouses
Cleaning missing, duplicate, or inconsistent data
Joining multiple data sources
Validating data accuracy and completeness
A significant portion of a Data Analyst’s time is spent here, ensuring the analysis is built on reliable data.
Analyzing Data and Identifying Insights
Once data is prepared, the Data Analyst:
Performs exploratory data analysis (EDA)
Identifies trends, patterns, and anomalies
Compares performance across time, segments, or dimensions
Calculates and interprets key metrics and KPIs
This is where analytical thinking matters most—knowing what to look for and what actually matters.
Creating Reports and Dashboards
Data Analysts often design dashboards and reports that:
Track performance against goals
Provide visibility into key metrics
Allow users to explore data interactively
Good dashboards focus on clarity and usability, not just visual appeal.
Communicating Findings
One of the most important (and sometimes underestimated) aspects of the role is communication. Data Analysts:
Explain results to non-technical audiences
Provide context and caveats
Recommend actions based on findings
Help stakeholders understand trade-offs and implications
An insight that isn’t understood or trusted is rarely acted upon.
Common Tools Used by Data Analysts
The specific tools vary, but many Data Analysts regularly work with:
SQL for querying and transforming data
Spreadsheets (e.g., Excel, Google Sheets) for quick analysis
BI & Visualization Tools (e.g., Power BI, Tableau, Looker)
Programming Languages (e.g., Python or R) for deeper analysis
Data Models & Semantic Layers for consistent metrics
A Data Analyst should know which tool is appropriate for a given task and should have good proficiency of the tools needed frequently.
What a Data Analyst Is Not
Understanding the boundaries of the role helps set realistic expectations.
A Data Analyst is typically not:
A data engineer responsible for building ingestion pipelines
A machine learning engineer deploying production models
A decision-maker replacing business judgment
However, Data Analysts often collaborate closely with these roles and may overlap in skills depending on team structure.
What the Role Looks Like Day-to-Day
On a practical level, a Data Analyst’s day might include:
Meeting with stakeholders to clarify requirements
Writing or refining SQL queries
Validating numbers in a dashboard
Investigating why a metric changed unexpectedly
Reviewing feedback on a report
Improving an existing dataset or model
The work is iterative—questions lead to answers, which often lead to better questions.
How the Role Evolves Over Time
As organizations mature, the Data Analyst role often evolves:
From ad-hoc reporting → standardized metrics
From reactive analysis → proactive insights
From static dashboards → self-service analytics enablement
From individual contributor → analytics lead or manager
Strong Data Analysts develop deep business understanding and become trusted advisors, not just report builders.
Why Data Analysts Are So Important
In an environment full of data, clarity is valuable. Data Analysts:
Reduce confusion by creating shared understanding
Help teams focus on what matters most
Enable faster, more confident decisions
Act as a bridge between data and the business
They ensure data is not just collected—but used effectively.
Final Thoughts
A Data Analyst’s job is not about charts, queries, or tools alone. It is about helping people make better decisions using data.
The best Data Analysts combine technical skills, analytical thinking, business context, and communication. When those come together, data stops being overwhelming and starts becoming actionable.
Thanks for reading and best wishes on your data journey!
Data conversions are critical undertakings in the world of IT and business, often required during system upgrades, migrations, mergers, or to meet new regulatory requirements. I have been involved in many data conversions over the years, and in this article, I am sharing information from that experience. This article provides a comprehensive guide to the stages, steps, and best practices for executing successful data conversions. This article was created from a detailed presentation I did some time back at a SQL Saturday event.
What Is Data Conversion and Why Is It Needed?
Data conversion involves transforming data from one format, system, or structure to another. Common scenarios include application upgrades, migrating to new systems, adapting to new business or regulatory requirements, and integrating data after mergers or acquisitions. For example, merging two customer databases into a new structure is a typical conversion challenge.
Stages of a Data Conversion Project
Let’s take a look at the stages of a data conversion project.
Stage 1: Big Picture, Analysis, and Feasibility
The first stage is about understanding the overall impact and feasibility of the conversion:
Understand the Big Picture: Identify what the conversion is about, which systems are involved, the reasons for conversion, and its importance. Assess the size, complexity, and impact on business and system processes, users, and external parties. Determine dependencies and whether the conversion can be done in phases.
Know Your Sources and Destinations: Profile the source data, understand its use, and identify key measurements for success. Compare source and destination systems, noting differences and existing data in the destination.
Feasibility – Proof of Concept: Test with the most critical or complex data to ensure the conversion will meet the new system’s needs before proceeding further.
Project Planning: Draft a high-level project plan and requirements document, estimate complexity and resources, assemble the team, and officially launch the project.
Stage 2: Impact, Mappings, and QA Planning
Once the conversion is likely, the focus shifts to detailed impact analysis and mapping:
Impact Analysis: Assess how business and system processes, reports, and users will be affected. Consider equipment and resource needs, and make a go/no-go decision.
Source/Destination Mapping & Data Gap Analysis: Profile the data, create detailed mappings, list included and excluded data, and address gaps where source or destination fields don’t align. Maintain legacy keys for backward compatibility.
QA/Verification Planning: Plan for thorough testing, comparing aggregates and detailed records between source and destination, and involve both IT and business teams in verification.
Stage 3: Project Execution, Development, and QA
With the project moving forward, detailed planning, development and validation, and user involvement become the priority:
Detailed Project Planning: Refine requirements, assign tasks, and ensure all parties are aligned. Communication is key.
Development: Set up environments, develop conversion scripts and programs, determine order of processing, build in logging, and ensure processes can be restarted if interrupted. Optimize for performance and parallel processing where possible.
Testing and Verification: Test repeatedly, verify data integrity and functionality, and involve all relevant teams. Business users should provide final sign-off.
Other Considerations: Train users, run old and new systems in parallel, set a firm cut-off for source updates, consider archiving, determine if any SLAs needed to be adjusted, and ensure compliance with regulations.
Stage 4: Execution and Post-Conversion Tasks
The final stage is about production execution and transition:
Schedule and Execute: Stick to the schedule, monitor progress, keep stakeholders informed, lock out users where necessary, and back up data before running conversion processes.
Post-Conversion: Run post-conversion scripts, allow limited access for verification, and where applicable, provide close monitoring and support as the new system goes live.
Best Practices and Lessons Learned
Involve All Stakeholders Early: Early engagement ensures smoother execution and better outcomes.
Analyze and Plan Thoroughly: A well-thought-out plan is the foundation of a successful conversion.
Develop Smartly and Test Vigorously: Build robust, traceable processes and test extensively.
Communicate Throughout: Keep all team members and stakeholders informed at every stage.
Pay Attention to Details: Watch out for tricky data types like DATETIME and time zones, and never underestimate the effort required.
Conclusion
Data conversions are complex, multi-stage projects that require careful planning, execution, and communication. By following the structured approach and best practices outlined above, organizations can minimize risks and ensure successful outcomes.
Artificial Intelligence (AI) is reshaping how supply chains operate across industries—making them smarter, more responsive, and more resilient. From demand forecasting to logistics optimization and predictive maintenance, AI helps companies navigate growing complexity and disruption in global supply networks.
What is AI in Supply Chain Management?
AI in Supply Chain Management (SCM) refers to using intelligent algorithms, machine learning, data analytics, and automation technologies to improve visibility, accuracy, and decision-making across supply chain functions. This includes planning, procurement, production, logistics, inventory, and customer fulfillment. AI processes massive and diverse datasets—historical sales, weather, social trends, sensor data, transportation feeds—to find patterns and make predictions that are faster and more accurate than traditional methods.
The current landscape sees widespread adoption from startups to global corporations. Leaders like Amazon, Walmart, Unilever, and PepsiCo all integrate AI across their supply chain operations to gain competitive edge and operational excellence.
How AI is Applied in Supply Chain Management
Here are some of the most impactful AI use cases in supply chain operations:
1. Predictive Demand Forecasting
AI models forecast demand by analyzing sales history, promotions, weather, and even social media trends. This helps reduce stockouts and excess inventory.
Examples:
Walmart uses machine learning to forecast store-level demand, reducing out-of-stock cases and optimizing orders.
Coca-Cola leverages real-time data for regional forecasting, improving production alignment with customer needs.
2. AI-Driven Inventory Optimization
AI recommends how much inventory to hold and where to place it, reducing carrying costs and minimizing waste.
Example: Fast-moving retail and e-commerce players use inventory tools that dynamically adjust stock levels based on demand and lead times.
3. Real-Time Logistics & Route Optimization
Machine learning and optimization algorithms analyze traffic, weather, vehicle capacity, and delivery windows to identify the most efficient routes.
Example: DHL improved delivery speed by about 15% and lowered fuel costs through AI-powered logistics planning.
News Insight:Walmart’s high-tech automated distribution centers use AI to optimize palletization, delivery routes, and inventory distribution—reducing waste and improving precision in grocery logistics.
4. Predictive Maintenance
AI monitors sensor data from equipment to predict failures before they occur, reducing downtime and repair costs.
5. Supplier Management and Risk Assessment
AI analyzes supplier performance, financial health, compliance, and external signals to score risks and recommend actions.
Example:Unilever uses AI platforms (like Scoutbee) to vet suppliers and proactively manage risk.
6. Warehouse Automation & Robotics
AI coordinates robotic systems and automation to speed picking, packing, and inventory movement—boosting throughput and accuracy.
Benefits of AI in Supply Chain Management
AI delivers measurable improvements in efficiency, accuracy, and responsiveness:
Improved Forecasting Accuracy – Reduces stockouts and overstock scenarios.
Lower Operational Costs – Through optimized routing, labor planning, and inventory.
Faster Decision-Making – Real-time analytics and automated recommendations.
Enhanced Resilience – Proactively anticipating disruptions like weather or supplier issues.
Challenges to Adopting AI in Supply Chain Management
Implementing AI is not without obstacles:
Data Quality & Integration: AI is only as good as the data it consumes. Siloed or inconsistent data hampers performance.
Talent Gaps: Skilled data scientists and AI engineers are in high demand.
Change Management: Resistance from stakeholders slowing adoption of new workflows.
Cost and Complexity: Initial investment in technology and infrastructure can be high.
Tools, Technologies & AI Methods
Several platforms and technologies power AI in supply chains:
Major Platforms
IBM Watson Supply Chain & Sterling Suite: AI analytics, visibility, and risk modeling.
SAP Integrated Business Planning (IBP): Demand sensing and collaborative planning.
Oracle SCM Cloud: End-to-end planning, procurement, and analytics.
Microsoft Dynamics 365 SCM: IoT integration, machine learning, generative AI (Copilot).
Blue Yonder: Forecasting, replenishment, and logistics AI solutions.
Kinaxis RapidResponse: Real-time scenario planning with AI agents.
Llamasoft (Coupa): Digital twin design and optimization tools.
Core AI Technologies
Machine Learning & Predictive Analytics: Patterns and forecasts from historical and real-time data.
Natural Language Processing (NLP): Supplier profiling, contract analysis, and unstructured data insights.
Robotics & Computer Vision: Warehouse automation and quality inspection.
Generative AI & Agents: Emerging tools for planning assistance and decision support.
IoT Integration: Live tracking of equipment, shipments, and environmental conditions.
How Companies Should Implement AI in Supply Chain Management
To successfully adopt AI, companies should follow these steps:
1. Establish a Strong Data Foundation
Centralize data from ERP, WMS, TMS, CRM, IoT sensors, and external feeds.
Ensure clean, standardized, and time-aligned data for training reliable models.
2. Start With High-Value Use Cases
Focus on demand forecasting, inventory optimization, or risk prediction before broader automation.
3. Evaluate Tools & Build Skills
Select platforms aligned with your scale—whether enterprise tools like SAP IBP or modular solutions like Kinaxis. Invest in upskilling teams or partner with implementation specialists.
4. Pilot and Scale
Run short pilots to validate ROI before organization-wide rollout. Continuously monitor performance and refine models with updated data.
5. Maintain Human Oversight
AI should augment, not replace, human decision-making—especially for strategic planning and exceptions handling.
The Future of AI in Supply Chain Management
AI adoption will deepen with advances in generative AI, autonomous decision agents, digital twins, and real-time adaptive networks. Supply chains are expected to become:
More Autonomous: Systems that self-adjust plans based on changing conditions.
Transparent & Traceable: End-to-end visibility from raw materials to customers.
Sustainable: AI optimizing for carbon footprints and ethical sourcing.
Resilient: Predicting and adapting to disruptions from geopolitical or climate shocks.
Emerging startups like Treefera are even using AI with satellite and environmental data to enhance transparency in early supply chain stages.
Conclusion
AI is no longer a niche technology for supply chains—it’s a strategic necessity. Companies that harness AI thoughtfully can expect faster decision cycles, lower costs, smarter demand planning, and stronger resilience against disruption. By building a solid data foundation and aligning AI to business challenges, organizations can unlock transformational benefits and remain competitive in an increasingly dynamic global market.
Power BI includes a feature called Autodetect new relationships that automatically creates relationships between tables when new data is loaded into a model. While convenient for simple datasets, this setting can cause unexpected behavior in more advanced data models.
How to Turn Off Autodetect New Relationships
You can disable this feature directly from Power BI Desktop:
Open Power BI Desktop
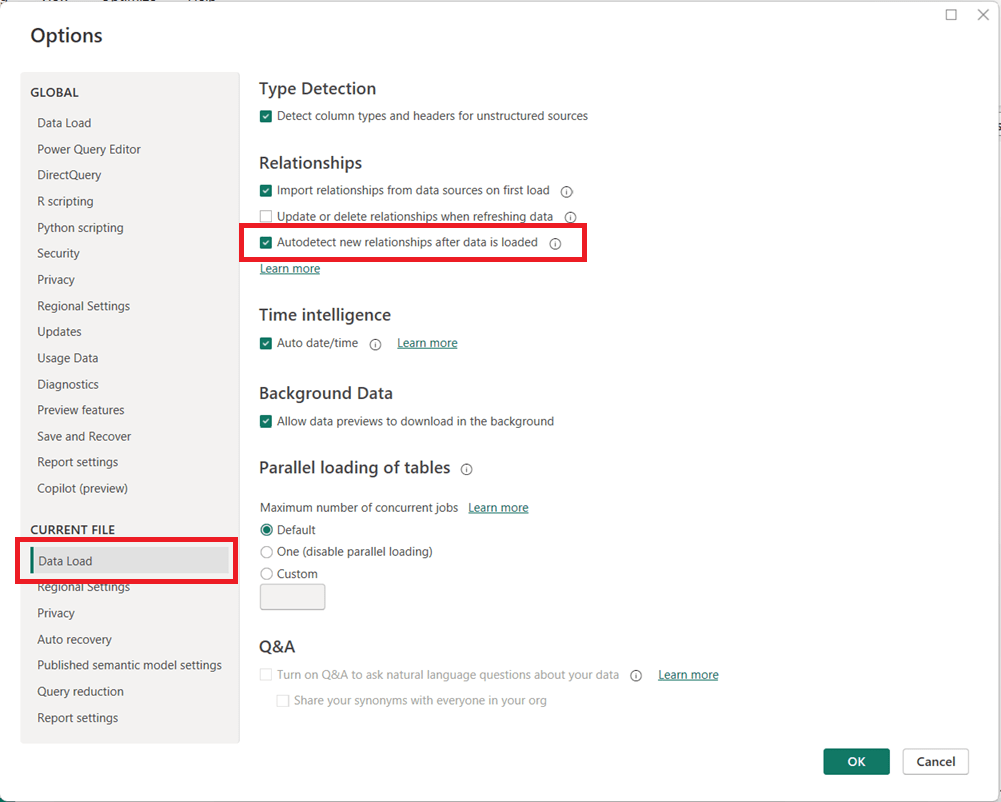
Go to File → Options and settings → Options
In the left pane, under CURRENT FILE, select Data Load
Then in the page’s main area, under the Relationships section, uncheck:
Autodetect new relationships after data is loaded
Click OK
Note that you may need to refresh your model for the change to fully take effect on newly loaded data.
Why You May Want to Disable This Feature
Turning off automatic relationship detection is considered a best practice for many professional Power BI models, especially as complexity increases.
Key reasons to disable it include:
Prevent unintended relationships This is the main reason. Power BI may create relationships you did not intend, based solely on matching column names or data types. Automatically generated relationships can introduce ambiguity and inactive relationships, leading to incorrect DAX results or performance issues.
Maintain full control of the data model, especially when the model needs to be carefully designed because of complexity or other reasons Manually creating relationships ensures they follow your star schema design and business logic. Complex models with role-playing dimensions, bridge tables, or composite models benefit from intentional, not automatic, relationships.
Improve model reliability and maintainability Explicit relationships make your model easier to understand, document, and troubleshoot.
When Autodetect Can Still Be Useful
Autodetect is a useful feature in some cases. For quick prototypes, small datasets, or ad-hoc analysis, automatic relationship detection can save time. However, once a model moves toward production or supports business-critical reporting, manual control is strongly recommended.
Welcome to the one-stop hub with information for preparing for the PL-300: Microsoft Power BI Data Analyst certification exam. Upon successful completion of the exam, you earn the Microsoft Certified: Power BI Data Analyst Associate certification.
This hub provides information directly here (topic-by-topic), links to a number of external resources, tips for preparing for the exam, practice tests, and section questions to help you prepare. Bookmark this page and use it as a guide to ensure that you are fully covering all relevant topics for the PL-300 exam and making use of as many of the resources available as possible.
Skills tested at a glance (as specified in the official study guide)
Prepare the data (25–30%)
Model the data (25–30%)
Visualize and analyze the data (25–30%)
Manage and secure Power BI (15–20%)
Click on each hyperlinked topic below to go to the preparation content and practice questions for that topic. And there are also 2 practice exams provided below.
Link to the free, comprehensive, self-paced course on Microsoft Learn – Design and manage analytics solutions using Power BI It contains 5 Learning Paths, each with multiple Modules, and each module has multiple Units. It will take some time to do it, but we recommend that you complete this entire course, including the exercises/labs.
Schedule time to learn, study, perform labs, and do practice exams and questions
Schedule the exam based on when you think you will be ready; scheduling the exam gives you a target and drives you to keep working on it; but keep in mind that it can be rescheduled based on the rules of the provider.
Use the various resources above and below to learn
Take the free Microsoft Learn practice test, any other available practice tests, and do the practice questions in each section and the two practice tests available on this hub.
Good luck to you passing the PL-300: Microsoft Power BI Data Analyst certification exam and earning the Microsoft Certified: Power BI Data Analyst Associate certification!
PL-300: Microsoft Power BI Data Analyst practice exam
Total Questions: 60 Time Recommendation: 120 minutes
Note: We have sectioned the questions to help you prepare, but the real exam will have questions from the sections appearing randomly.
The answers are at the end, and we recommend only looking at the answers after you have attempted the questions.
Exam Structure & Weighting (60 Questions)
Domain
%
Questions
Prepare the data
~27%
16
Model the data
~27%
16
Visualize and analyze the data
~27%
16
Manage and secure Power BI
~19%
12
Total
100%
60
SECTION 1: Prepare the Data (Questions 1–16)
1. (Single choice) You connect to a CSV file containing sales data. The file is updated daily with additional rows. What should you do to ensure Power BI always imports only new records?
A. Use Import mode B. Enable Incremental Refresh C. Use DirectQuery D. Create a calculated table
2. (Scenario – Multi-select) You are cleaning customer data in Power Query. You need to:
Remove rows where CustomerID is null
Replace empty strings in Country with “Unknown”
Which two steps should you use? (Select two)
A. Filter rows B. Replace values C. Conditional column D. Remove errors
3. (Fill in the blank) The Power Query feature used to profile data by showing column distribution, quality, and profile is called __________.
4. (Single choice) You want to reduce model size by removing unused columns before loading data. Where should this be done?
A. In DAX B. In Power BI Service C. In Power Query Editor D. In the Data view
5. (Scenario – Single choice) A dataset contains numeric values stored as text. What is the best approach to fix this?
A. Convert data type in the report view B. Create a calculated column C. Change data type in Power Query D. Use FORMAT() in DAX
6. (Multi-select) Which transformations are considered query folding–friendly? (Select two)
A. Filtering rows B. Adding an Index column C. Merging queries D. Custom M function logic
7. (Single choice) What does query folding primarily help with?
A. Improving report aesthetics B. Reducing dataset size C. Pushing transformations to the source system D. Enabling DirectQuery
8. (Scenario – Single choice) You want to append monthly Excel files from a folder automatically. What connector should you use?
A. Excel Workbook B. SharePoint Folder C. Folder D. Web
9. (Matching) Match the Power Query feature to its purpose:
Feature
Purpose
A. Merge Queries
1. Stack tables vertically
B. Append Queries
2. Combine tables horizontally
C. Group By
3. Aggregate rows
10. (Single choice) Which data source supports DirectQuery?
A. Excel B. CSV C. SQL Server D. JSON
11. (Scenario – Multi-select) You want to reduce refresh time. Which actions help? (Select two)
A. Remove unused columns B. Increase report page count C. Apply filters early D. Use calculated columns
12. (Single choice) What does enabling “Enable load” = Off do?
A. Deletes the query B. Prevents data refresh C. Prevents data from loading into the model D. Disables query folding
13. (Single choice) Which transformation breaks query folding most often?
A. Filtering B. Sorting C. Custom column with M code D. Renaming columns
14. (Fill in the blank) The language used by Power Query is called __________.
15. (Scenario – Single choice) You need to standardize country names across multiple sources. What is the best approach?
A. DAX LOOKUPVALUE B. Power Query Replace Values C. Calculated table D. Visual-level filter
16. (Single choice) What is the main benefit of disabling Auto Date/Time?
A. Faster report rendering B. Better compression and simpler models C. Enables time intelligence D. Required for DirectQuery
SECTION 2: Model the Data (Questions 17–32)
17. (Single choice) What is the recommended cardinality between a fact table and a dimension table?
A. Many-to-many B. One-to-one C. One-to-many D. Many-to-one
18. (Scenario – Single choice) You have Sales and Customers tables. Each sale belongs to one customer. How should the relationship be defined?
A. Many-to-many B. One-to-many from Customers to Sales C. One-to-one D. Inactive
19. (Multi-select) Which actions improve model performance? (Select two)
A. Reduce column cardinality B. Use bi-directional filters everywhere C. Star schema design D. Hide fact table columns
20. (Fill in the blank) A __________ table contains descriptive attributes used for slicing and filtering.
21. (Scenario – Single choice) When should you use a calculated column instead of a measure?
A. When performing aggregations B. When results must be stored per row C. When using slicers D. When reducing model size
22. (Single choice) Which DAX function safely handles divide-by-zero errors?
A. DIV B. IFERROR C. DIVIDE D. CALCULATE
23. (Scenario – Single choice) You need a dynamic calculation that responds to filters. What should you use?
A. Calculated column B. Calculated table C. Measure D. Static column
24. (Matching) Match the DAX concept to its description:
Concept
Description
A. Row context
1. Filters applied by visuals
B. Filter context
2. Iteration over rows
C. Context transition
3. Row → filter conversion
25. (Single choice) What does CALCULATE primarily do?
A. Creates relationships B. Changes filter context C. Adds rows to tables D. Improves compression
26. (Multi-select) Which are valid time intelligence functions? (Select two)
A. TOTALYTD B. SAMEPERIODLASTYEAR C. SUMX D. VALUES
27. (Scenario – Single choice) You need Year-over-Year growth. What prerequisite must be met?
A. Auto Date/Time enabled B. Continuous date column C. Marked Date table D. Calculated column
28. (Single choice) What does marking a table as a Date table do?
A. Improves visuals B. Enables time intelligence accuracy C. Reduces refresh time D. Enables RLS
29. (Multi-select) Which DAX functions are iterators? (Select two)
A. SUMX B. AVERAGEX C. SUM D. COUNT
30. (Scenario – Single choice) You need to model a many-to-many relationship. What is the recommended solution?
A. Bi-directional filters B. Bridge table C. Calculated column D. Duplicate keys
31. (Single choice) What is the main drawback of bi-directional relationships?
A. Slower refresh B. Increased ambiguity and performance cost C. Larger dataset size D. Disabled measures
32. (Fill in the blank) The recommended schema design in Power BI is the __________ schema.
SECTION 3: Visualize and Analyze the Data (Questions 33–48)
33. (Single choice) Which visual best shows trends over time?
A. Bar chart B. Table C. Line chart D. Card
34. (Scenario – Single choice) You want users to explore details by clicking on a value in a chart. What feature should you use?
A. Drillthrough B. Tooltip C. Drill-down D. Bookmark
35. (Multi-select) Which visuals support drill-down? (Select two)
A. Matrix B. Card C. Bar chart D. KPI
36. (Fill in the blank) A page that shows detailed information for a selected data point is called a __________ page.
37. (Single choice) Which feature allows navigation between predefined report states?
A. Filters B. Slicers C. Bookmarks D. Tooltips
38. (Scenario – Single choice) You want to highlight values above a threshold. What should you use?
A. Conditional formatting B. Custom visual C. Calculated column D. Page filter
39. (Multi-select) Which elements can be used as slicers? (Select two)
A. Numeric columns B. Measures C. Date columns D. Calculated tables
40. (Single choice) What does a tooltip page provide?
A. Navigation B. Additional context on hover C. Data refresh D. Security
41. (Scenario – Single choice) You want visuals on one page to affect another page. What should you use?
A. Drill-down B. Sync slicers C. RLS D. Visual interactions
42. (Single choice) Which feature allows exporting summarized data only?
A. Export underlying data B. Export summarized data C. Analyze in Excel D. Paginated reports
43. (Multi-select) Which actions improve report performance? (Select two)
A. Limit visuals per page B. Use high-cardinality slicers C. Use measures instead of columns D. Disable interactions
44. (Single choice) What is the purpose of a KPI visual?
A. Show raw data B. Compare actuals to targets C. Display trends D. Filter visuals
45. (Scenario – Single choice) You need a visual that supports hierarchical navigation. What should you choose?
A. Card B. Line chart C. Matrix D. Gauge
46. (Fill in the blank) The feature that allows users to ask natural language questions is called __________.
47. (Single choice) What determines visual interaction behavior?
A. Data model B. Report theme C. Edit interactions settings D. Dataset permissions
48. (Single choice) Which visual is best for comparing proportions?
A. Table B. Pie chart C. Scatter plot D. Line chart
SECTION 4: Manage and Secure Power BI (Questions 49–60)
49. (Single choice) What does Row-Level Security (RLS) control?
A. Visual visibility B. Data access by user C. Dataset refresh D. Workspace roles
50. (Scenario – Single choice) You need different users to see different regions’ data. What should you implement?
A. App audiences B. RLS roles C. Workspace permissions D. Object-level security
51. (Multi-select) Which roles can publish content? (Select two)
A. Viewer B. Contributor C. Member D. Admin
52. (Single choice) Where is RLS created?
A. Power BI Service only B. Power BI Desktop C. Azure Portal D. Excel
53. (Single choice) What is Object-Level Security (OLS) used for?
A. Hiding rows B. Hiding columns or tables C. Encrypting data D. Managing refresh
54. (Scenario – Single choice) You want users to consume reports without editing. Which workspace role is best?
A. Admin B. Member C. Contributor D. Viewer
55. (Fill in the blank) A packaged, read-only distribution of reports is called a Power BI __________.
56. (Single choice) Which feature controls dataset refresh schedules?
A. Gateway B. Dataset settings C. Workspace D. App
57. (Multi-select) Which authentication methods are supported by Power BI gateways? (Select two)
A. Windows B. OAuth C. Basic D. Anonymous
58. (Scenario – Single choice) You want on-premises SQL data to refresh in Power BI Service. What is required?
A. DirectQuery B. On-premises data gateway C. Azure SQL D. Incremental refresh
59. (Single choice) Who can manage workspace users?
A. Viewer B. Contributor C. Member D. Admin
60. (Single choice) What is the primary benefit of Power BI apps?
A. Faster refresh B. Centralized content distribution C. Improved DAX performance D. Reduced dataset size
ANSWER KEY WITH EXPLANATIONS
Below are correct answers and explanations, including why incorrect options are not correct. (Use this section after completing the exam.)
SECTION 1: Prepare the Data (1-16)
B – Incremental Refresh loads only new/changed data
A, B – Filter rows removes nulls; Replace Values handles empty strings
Data profiling
C – Remove columns before loading
C – Best practice is Power Query transformation
A, C – Folding-friendly operations
C – Pushes logic to the source
C – Folder connector handles multiple files
A-2, B-1, C-3
C – SQL Server supports DirectQuery
A, C – Reduce data early
C – Prevents model loading
C – Custom M breaks folding
M
B – Clean once at ingestion
B – Avoids hidden date tables
SECTION 2: Model the Data (17–32)
17. Correct Answer: C — One-to-many
Why correct: In a star schema, dimension tables have unique keys and fact tables contain repeated keys.
Why others are incorrect:
A/B/D create ambiguity or are rarely appropriate in analytical models.
18. Correct Answer: B — One-to-many from Customers to Sales
Why correct: One customer can have many sales, but each sale belongs to one customer.
Why others are incorrect:
Many-to-many and one-to-one do not reflect the business reality.
Inactive relationships are only used when multiple relationships exist.
19. Correct Answers: A, C
Why correct:
Reducing column cardinality improves compression.
Star schemas reduce relationship complexity and improve performance.
Why others are incorrect:
Bi-directional filters add overhead.
Hiding columns improves usability, not performance.
PL-300: Microsoft Power BI Data Analyst practice exam
Total Questions: 60 Time Recommendation: 120 minutes
Note: We have sectioned the questions to help you prepare, but the real exam will have questions from the sections appearing randomly.
The answers are at the end, and we recommend only looking at the answers after you have attempted the questions.
SECTION 1: Prepare the Data (Questions 1–16)
1. (Scenario – Single choice) You are importing data from a SQL Server database. You want to ensure transformations are executed at the source whenever possible. What should you prioritize?
A. Using Import mode B. Maintaining query folding C. Creating calculated columns D. Disabling Auto Date/Time
2. (Multi-select) Which Power Query actions typically preserve query folding? (Select two)
A. Filtering rows B. Adding a custom column with complex M logic C. Removing columns D. Changing column order
3. (Fill in the blank) Power BI’s feature that automatically detects column data types during import is called __________.
4. (Scenario – Single choice) You need to combine two tables with the same columns but different rows. What should you use?
A. Merge Queries B. Append Queries C. Relationship D. Lookup column
5. (Single choice) Which data type is most memory-efficient for categorical values?
A. Text B. Whole Number C. Decimal Number D. DateTime
6. (Scenario – Multi-select) You are profiling a dataset and notice unexpected null values. Which tools help identify data quality issues? (Select two)
A. Column quality B. Column distribution C. Conditional columns D. Replace errors
7. (Single choice) Which connector allows ingestion of multiple files stored in a directory?
A. Excel Workbook B. SharePoint List C. Folder D. Web API
8. (Scenario – Single choice) You want to standardize values such as “USA”, “U.S.”, and “United States”. What is the most scalable solution?
A. DAX calculated column B. Replace Values in Power Query C. Visual-level filter D. Manual edits in Data view
9. (Matching) Match the transformation to its outcome:
Transformation
Outcome
A. Group By
1. Reduce row-level detail
B. Remove duplicates
2. Aggregate data
C. Filter rows
3. Exclude unwanted records
10. (Single choice) Which data source does NOT support DirectQuery?
A. Azure SQL Database B. SQL Server C. Excel workbook D. Azure Synapse Analytics
11. (Scenario – Single choice) A column contains numbers and text. You need to fix errors without removing rows. What is the best option?
A. Remove errors B. Replace errors C. Change data type D. Split column
12. (Multi-select) Which actions reduce dataset size? (Select two)
A. Removing unused columns B. Increasing column cardinality C. Disabling Auto Date/Time D. Using calculated tables
13. (Single choice) Which step most commonly breaks query folding?
A. Sorting rows B. Renaming columns C. Adding a custom M function D. Filtering
14. (Fill in the blank) Power Query transformations are written using the __________ language.
15. (Scenario – Single choice) You want to reuse a transformation across multiple queries. What should you create?
A. Calculated table B. Custom column C. Function D. Measure
16. (Single choice) Why is disabling Auto Date/Time considered a best practice?
A. It improves visual formatting B. It reduces hidden tables and model size C. It enables DirectQuery D. It improves gateway performance
SECTION 2: Model the Data (Questions 17–32)
17. (Single choice) Which schema design is recommended for Power BI models?
A. Snowflake B. Relational C. Star D. Hierarchical
18. (Scenario – Single choice) You have multiple fact tables sharing the same Date table. What relationship setup is recommended?
A. Many-to-many B. One-to-one C. One-to-many from Date D. Bi-directional
19. (Multi-select) Which actions improve DAX performance? (Select two)
A. Using variables B. Using volatile functions C. Reducing iterator usage D. Increasing column cardinality
20. (Fill in the blank) A table that stores transactional events is called a __________ table.
21. (Scenario – Single choice) You need a calculation that must be evaluated only once during refresh. What should you use?
A. Measure B. Calculated column C. Visual filter D. Slicer
22. (Single choice) Which function changes filter context?
A. SUM B. FILTER C. CALCULATE D. VALUES
23. (Scenario – Single choice) You need a metric that responds to slicers and cross-highlighting. What should you create?
A. Calculated table B. Calculated column C. Measure D. Static column
24. (Matching) Match the DAX concept to its definition:
Concept
Definition
A. Filter context
1. Row-by-row evaluation
B. Row context
2. Visual and slicer filters
C. Iterator
3. Loops through rows
25. (Single choice) Which DAX function safely handles division when the denominator is zero?
A. IF B. DIV C. DIVIDE D. CALCULATETABLE
26. (Multi-select) Which functions are considered time intelligence? (Select two)
A. DATEADD B. SAMEPERIODLASTYEAR C. SUMX D. FILTER
27. (Scenario – Single choice) Why should you mark a Date table?
A. To enable RLS B. To improve visual formatting C. To ensure correct time intelligence D. To reduce refresh duration
28. (Single choice) What is the purpose of a bridge table?
A. Speed up refresh B. Resolve many-to-many relationships C. Enable DirectQuery D. Create calculated measures
29. (Multi-select) Which are iterator functions? (Select two)
A. COUNT B. SUMX C. AVERAGEX D. DISTINCT
30. (Scenario – Single choice) You have two date relationships between the same tables. One is inactive. How do you use the inactive one?
A. USERELATIONSHIP B. CROSSFILTER C. RELATED D. LOOKUPVALUE
31. (Single choice) What is a key downside of calculated columns?
A. They cannot be filtered B. They increase model size C. They cannot use DAX D. They slow down visuals
32. (Fill in the blank) The recommended relationship direction in most models is __________.
SECTION 3: Visualize and Analyze the Data (Questions 33–48)
33. (Single choice) Which visual best compares values across categories?
A. Line chart B. Bar chart C. Scatter plot D. Area chart
34. (Scenario – Single choice) You want users to navigate to a detail page by right-clicking a visual. What should you configure?
A. Drill-down B. Drillthrough C. Bookmark D. Tooltip
35. (Multi-select) Which visuals support hierarchies? (Select two)
A. Matrix B. Card C. Bar chart D. Gauge
36. (Fill in the blank) A report page designed to show details for a selected value is called a __________ page.
37. (Single choice) Which feature allows toggling between different visual states?
A. Filters B. Bookmarks C. Themes D. Sync slicers
38. (Scenario – Single choice) You want values over target to appear green and under target red. What should you use?
A. KPI visual B. Conditional formatting C. Measure D. Theme
39. (Multi-select) Which fields can be used in a slicer? (Select two)
A. Measures B. Date columns C. Text columns D. Tooltips
40. (Single choice) What is the primary purpose of report tooltips?
A. Navigation B. Additional context on hover C. Filtering D. Security
41. (Scenario – Single choice) You want slicer selections on one page to apply to other pages. What should you use?
A. Drillthrough B. Visual interactions C. Sync slicers D. Bookmarks
42. (Single choice) Which export option respects RLS and aggregation?
A. Export underlying data B. Export summarized data C. Copy visual D. Analyze in Excel
43. (Multi-select) Which actions improve report performance? (Select two)
A. Reduce number of visuals B. Use complex custom visuals everywhere C. Prefer measures over columns D. Increase page interactions
44. (Single choice) What does a KPI visual compare?
A. Actual vs target B. Categories vs totals C. Trends over time D. Part-to-whole
45. (Scenario – Single choice) Which visual supports row and column grouping with totals?
A. Table B. Matrix C. Card D. Gauge
46. (Fill in the blank) The feature that allows users to ask questions using natural language is __________.
47. (Single choice) Where do you configure how visuals affect each other?
A. Model view B. Edit interactions C. Dataset settings D. Themes
48. (Single choice) Which visual is best for showing part-to-whole relationships?
A. Line chart B. Pie chart C. Scatter plot D. Table
SECTION 4: Manage and Secure Power BI (Questions 49–60)
49. (Single choice) Row-Level Security primarily restricts access to:
A. Reports B. Rows of data C. Dashboards D. Workspaces
50. (Scenario – Single choice) Different users must see different departments’ data using the same report. What should you implement?
A. App audiences B. RLS roles C. Workspace permissions D. Bookmarks
51. (Multi-select) Which workspace roles can publish content? (Select two)
A. Viewer B. Contributor C. Member D. Admin
52. (Single choice) Where are RLS roles defined?
A. Power BI Service B. Power BI Desktop C. Azure AD D. SQL Server
53. (Single choice) What does Object-Level Security control?
A. Row visibility B. Column or table visibility C. Dataset refresh D. Report access
54. (Scenario – Single choice) Which role should be assigned to users who only consume content?
A. Admin B. Member C. Contributor D. Viewer
55. (Fill in the blank) A curated, read-only package of Power BI content is called an __________.
56. (Single choice) Which component enables scheduled refresh for on-premises data?
A. DirectQuery B. Dataset C. Gateway D. Workspace
57. (Multi-select) Which authentication types are supported by on-premises data gateways? (Select two)
A. Windows B. OAuth C. Basic D. Anonymous
58. (Scenario – Single choice) You want to minimize refresh time for a very large dataset. What should you configure?
A. RLS B. Incremental refresh C. DirectQuery D. OLS
59. (Single choice) Who can manage users and permissions in a workspace?
A. Viewer B. Contributor C. Member D. Admin
60. (Single choice) What is a primary advantage of Power BI apps?
A. Faster DAX calculations B. Controlled content distribution C. Reduced data volume D. Improved gateway reliability
ANSWER KEY WITH EXPLANATIONS
Prepare the Data (1–16)
B — Query folding pushes transformations to the source
A, C — Filtering and removing columns fold well
Type detection
B — Append stacks rows
B — Whole numbers compress best
A, B — Profiling tools reveal quality issues
C — Folder connector ingests multiple files
B — Clean once at ingestion
A-2, B-1, C-3
C — Excel does not support DirectQuery
B — Replace errors preserves rows
A, C — Less data, fewer hidden tables
C — Custom M breaks folding
M
C — Functions promote reuse
B — Prevents unnecessary date tables
Model the Data (17–32)
C — Star schema is best practice
C — Date is a shared dimension
A, C — Variables and fewer iterators improve performance
Fact
B — Calculated columns are refresh-time only
C — CALCULATE modifies filters
C — Measures are dynamic
A-2, B-1, C-3
C — DIVIDE handles zero safely
A, B — Both are time intelligence
C — Required for correct time calcs
B — Bridge resolves many-to-many
B, C — Iterators loop rows
A — USERELATIONSHIP activates inactive relationships
B — Stored in memory
Single-direction
Visualize & Analyze (33–48)
B — Best for categorical comparison
B — Drillthrough navigates pages
A, C — Support hierarchies
Drillthrough
B — Bookmarks store states
B — Conditional formatting applies rules
B, C — Columns only
B — Context on hover
C — Sync slicers cross pages
B — Respects aggregation & security
A, C — Fewer visuals, measures preferred
A — Actual vs target
B — Matrix supports grouping
Q&A
B — Edit interactions
B — Part-to-whole
Manage & Secure (49–60)
B — RLS filters rows
B — Role-based filtering
B, D — Can publish
B — Defined in Desktop
B — Hides columns/tables
D — Viewer is read-only
App
C — Gateway enables refresh
A, C — Supported auth types
B — Incremental refresh
D — Admin manages users
B — Centralized, controlled distribution
Information and resources for the data professionals' community