This post discusses Quality Assurance (QA) activities for data
projects.
What is Quality Assurance (QA)?
Simply put, Quality Assurance, also called QA, Testing or Validation, is
about testing an application or solution to ensure that all the
stated/promised/expected requirements are met. It is a critically important
activity for all software application development or implementations. Data
applications are no different. They need to be tested to ensure they work as
intended.
QA stands between development and deployment. And QA makes the
difference between a delivered product and a high quality delivered product.
There are a number of things to keep in mind when you plan your Quality
Assurance activities for data solutions. I present some of them in this post as
suggestions, considerations, or prompting questions. The things mentioned here
will not apply to all data applications but can be used as a guide or a check.
People / Teams
The number of people and teams involved in a project will vary
depending on the size, scope and complexity of the project.
The technical team building the application needs to perform an initial
level of validation of the solution.
If there is a Quality Assurance team that performs the validation
tasks, then that team will need to perform the “official” validation.
The business analysts and end-users of the application also need to
validate. Where possible, work with as many end users as efficiently possible.
The more real users you have testing the application, the better the chances of
finding issues early.
Where it makes sense, Test IDs that simulate various types of users or
groups should be used to help test various usage and security scenarios. This
is particularly useful in automated testing.
On large projects where there is a lot to be tested, it is best to break
up the testing across multiple people or teams. This will help to prevent
testing fatigue and sloppy testing and result in higher quality testing.
Plan ahead to ensure that access for all the relevant users is set up
in the testing environments.
Communication
With all the teams and people involved, it is important to have a plan
for how they will communicate. Things to consider and have a plan for include:
- How will teams communicate within? Email,
Microsoft Teams, SharePoint, Shared Files, are some options.
- How will the various teams involved communicate
with each other? In other words, how will cross-team communication be handled?
As above, Email, Microsoft Teams, SharePoint, Shared Files, are some options.
- How will issues and status be communicated?
Weekly meetings, Status emails or documents, Shared files available on shared
spaces are options.
- How will changes and resolutions be tracked?
Files, SDLC applications, Change Management applications are options.
- How will teams and individuals be notified when
they need to perform a task? Manual communication or automated notifications
from tools are options.
Data
The most important thing to ensure in data projects is that the data is
high quality, particularly the “base” data set. If the base data is incorrect,
everything built on top of it will be bad. Of course, the correctness of
intermediate and user-facing data is also just as important, but the validation
of the base data is critical to achieving the correct data all over.
- Ensure that table counts, field counts and row counts of key data are correct.
- Does the data warehouse data match the source data?
- Test detailed, low level records with small samples of data
- Test to ensure that the data and the values conform to what is expected. For example, ensuring that there is no data older than 3 years old, or ensuring that there are no account values outside a certain range. The Data Governance Team may become involved in these activities across all projects.
Next in line is the “intermediate” data such as derived metrics,
aggregates, specialized subsets, and more. These will also need to be verified.
- Are the calculated values correct?
- Are the aggregates correct? Test aggregate data
with small, medium and large sets of data
- Verify metric calculations
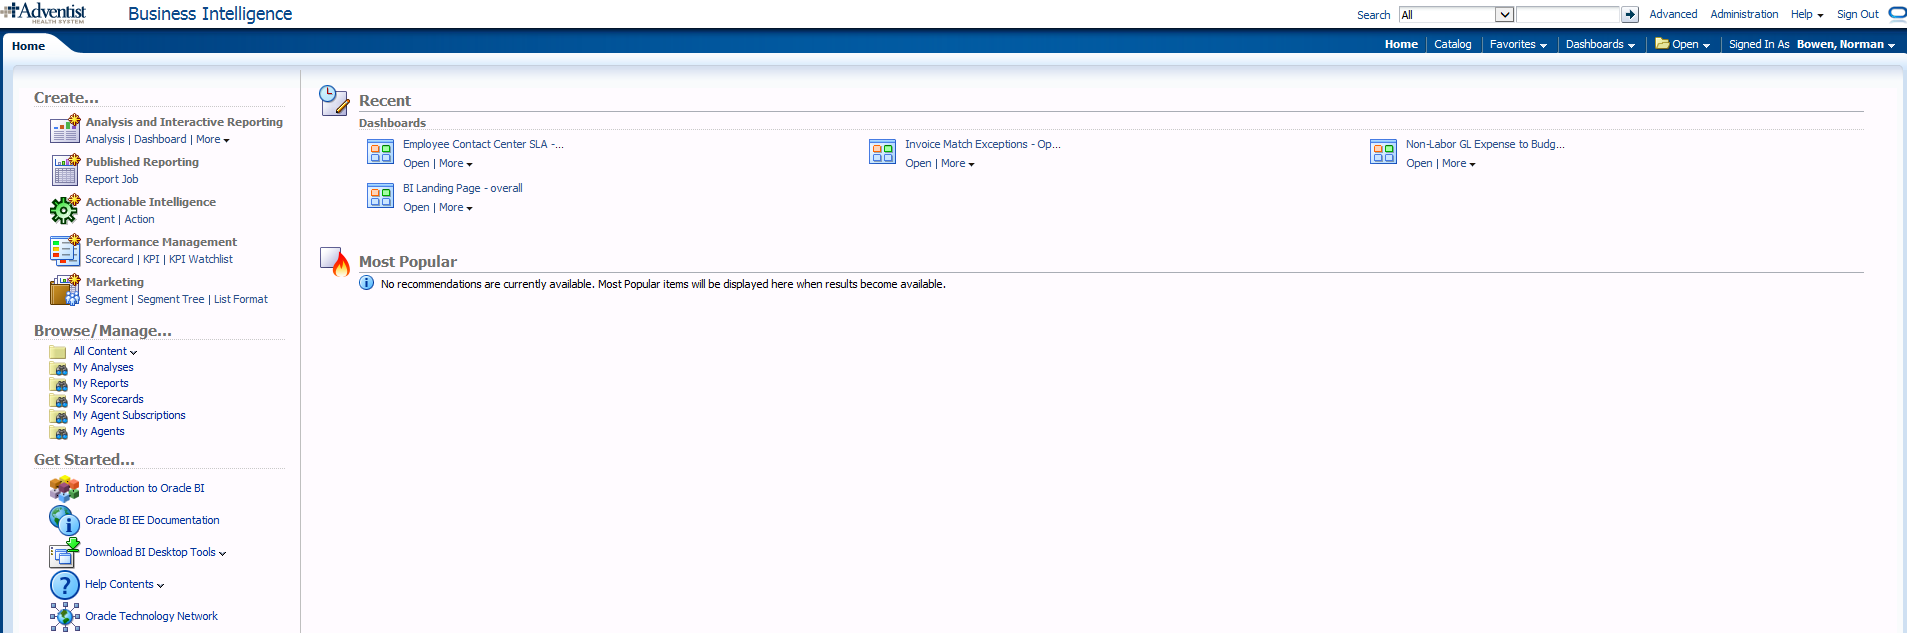
Then the user-facing data or data prepared for self-service usage needs
to be validated.
- Does the data on the dashboard match the data in
the database?
- Are the KPIs correctly reflecting the status?
Test the full flow of the data. The validity of the data should be
verified at each stage of the data flow – from the source, to the staging, to
the final tables in the data warehouse, to aggregates or subsets, to the
dashboard.
Take snapshots of key datasets or reports so you can compare results
post data migration.
Some additional data prep might be needed in some cases.
- These include making sure that you have sourced
adequate data for testing. For example, if you need to test an annual trend,
then it might be best to have at least a year’s worth of data, preferably two.
- You may need to scramble or redact some data for
testing. Often Test data is taken from the Production environment and then
scrambled and/or redacted in order to not expose sensitive information.
- You may need to temporarily load in data for
testing. For various reasons, you may need to load some Production data into
the QA environment just to test the solution or a particular feature and then
remove the data after the testing is complete. While this can be time
consuming, sometimes it’s necessary, and it’s good to be aware of the need
early and make plans accordingly.
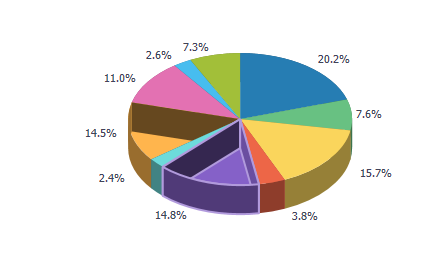
Aesthetics & Representation of Data
Presentation matters. Although the most critical thing is data
correctness, how the data is presented is also very important. Good
presentation helps with understanding, usability, and adoption. A few things to
consider include:
- Does the application, such as dashboard, look
good? Does it look right?
- Are the components laid out properly so that
there is no overcrowding?
- Are the logos, colors and fonts in line with
company expectations?
- Are proper chart options used to display the various
types of data and metrics?
- Is the information provided in a way that users
can digest?
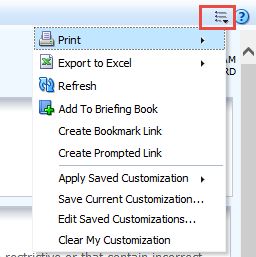
Usage
The data application or solution should be user friendly, preferably
intuitive or at least have good documentation. The data must be useful to the
intended audience, in that, it should help them to understand the information
and make good decisions or take sensible actions based on it.
The application should present data in a manner that is effective – easy
to access, and easy to understand.
The presentation should satisfy the analytic workflows of the various
users. Users should be able to logically step through the application to find
information at the appropriate level of detail that they need based on their
role.
A few things that affect usability include:
- Prompts – ensure that all the proper prompts or
selections are available to users to slice and filter the data as necessary.
And of course, verify that they work.
- Drill downs and drill throughs – validate that
users can drill-down and across data to find the information they need in a
simple, logical manner.
- Easy interrogation of the data – if the
application is ad-hoc in nature, validate that users can navigate it or at
least verify that the documentation is comprehensive enough for users to
follow.
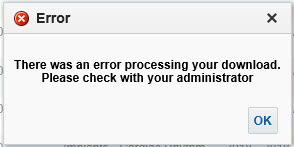
Security
Securing the application and its data so that only authorized users
have access to it is critical.
Application security comprises of “authentication”– access to the
application, and “authorization” – what a user is authorized to do when he or
she accesses the application.
Authorization (what a user is authorized to do within the application)
can be broken into “object security” – what objects or features a user has
access to, and “data security” – what data elements a user has access to within
the various objects or features.
For example, a user has access to an application (authenticated / can
log in), and within the application the user has access to (authorized to see
and use) 3 of 10 reports (object-level security). The user is not authorized to
see the other 7 reports (object-level security) and, therefore, will not have
access to them. Now, within the 3 reports that the user has access to, he or
she can only see data related to 1 of 5 departments (data-level security).
All object-level and data-level security needs to be validated. This
includes negative testing. Not only test to make sure that users have the
access they need, but testing should also ensure that users do not have access
that they should not have.
- Data for testing should be scrambled or redacted
as appropriate to protect it.
- Some extremely sensitive data may need to be
filtered out entirely.
- Can all the appropriate users access the
application?
- Are non-authorized users blocked from accessing
the application?
- Can user see the data they should be able to see
to perform their jobs?
Performance
Performance of the data solution is important to user efficiency and
user adoption. If users cannot get the results they need in a timely manner,
they will look elsewhere to get what they need. Even if they have no choice, a
poorly performing application will result in wasted time and dollars.
A few things to consider for ensuring quality around performance:
- Application usage – is the performance
acceptable? Do the results get returned in an acceptable time?
- Data Integration – is the load performance
acceptable?
- Data processing – can the application perform
all the processing it needs to do in a reasonable amount of time?
- Stress Testing – how is performance with many
users? How is it with a lot data?
- How is performance with various selections or
with no selections at all?
- Is ad-hoc usage setup to be flexible but avoid
rogue analyses that may cripple the system?
- Is real-time analysis needed and is the
application quick enough?
These items need to be validated and any issues need to be reported to the appropriate teams for performance tuning before the application is released for general usage.
Methodology
Each organization, and even each team within an organization, will have
a preferred methodology for application development and change management,
including how they perform QA activities.
Some things to consider include:
- Get QA resources involved in projects early so
that they gain an early understanding of the requirements and the solutions to
assess and plan how best to test.
- When appropriate, do not wait until all testing
is complete before notifying development teams of issue discovered. By
notifying them early, this could make the difference between your project being
on-time or late.
- Create a test plan and test scripts – even if
they are high-level.
- Where possible, execute tasks in an agile, iterative
manner.
- Each environment will have unique rules and
guidelines that need to be validated. For example, your application may have a
special naming convention, color & font guidelines, special metadata items,
and more. You need to validate that these rules and guidelines are followed.
- Use a checklist to ensure that you validate with
consistency from deliverable to deliverable
- When the solution being developed is replacing
an existing system or dataset, use the new and old solutions in parallel to
validate the new against the old.
- Document test results. All testing participants
should document what has been tested and the results. This may be as simple as
a checkmark or a “Done” status, but may also include things like data entered,
screenshots, results, errors, and more.
- Update the appropriate tracking tools (such as
your SDLC or Change Management tools) to document changes and validation. These
tools will vary from company to company, but it is best to have a trail of the
development, testing, and release to production.
- For each company and application, there will a
specific, unique set of things that will need to be done. It is best if you
have a standard test plan or test checklist to help you confirm that you have
tested all important aspects and scenarios of the application.
This is not an all-encompassing coverage of Quality Assurance for data solutions, but I hope the article gives you enough information to get started or tips for improving what you currently have in place. You can share your questions, thoughts and input via comments to this post. Thanks for reading!


 OBIEE 12c
 OBIEE 12c