In this post, I will quickly show how to perform 3 key transformations in Power BI – Transpose, Pivot, and Unpivot – and what impact they have on the data they are applied to. These transformations are often needed to manipulate the original data to get it into the shape needed to create the Power BI model and reports. We will use a simple example so that you can see clearly the effect of each transformation.
This is the original dataset – Student Grades:
Transpose
Transpose the data by going to the Transform ribbon and clicking “Transpose”.
This is what the data looks like after the Transpose transformation is applied. The rows are converted into columns, and the columns are converted into rows. Default headers / column names are applied.
Pivot Column
Starting with the original dataset, we will now Pivot the dataset. Go to Transform ribbon, click on “Pivot Column”.
The Pivot Column dialog opens. As noted, it will use the values in the Names column to create new columns, and will use the Score column as the Values Column.
This is what the data looks like after Pivot is applied as described above. Pivot Column converts the selected Name column values into column headers.
Unpivot Columns
Starting with the original dataset, we will now Unpivot the dataset. First select all 4 name columns by using “Ctrl + Click”.
Then, go to Transform ribbon, click on “Unpivot Columns”. This is what the data looks like after the Unpivot Columns transformation is applied. Unpivot Columns converts the selected columns (the name columns in this case) into a column of values (Attribute) and the column values are stored in the Value column.
If you have closed the Query Settings pane (the pane that has the APPLIED STEPS) in Power Query of Power BI and need to bring it back (reopen it), go to the View ribbon, and click the “Query Settings” icon.
The Query Settings pane which shows all the APPLIED STEPS (transformations) that have been applied to the data brought into the Power BI application will open at the right of the screen (where it normally resides).
It is common to have the need to perform time-driven analysis on your data. For example, you may need to compare this month’s sales with the sales from the same period a year ago or you may need to calculate the number of days between two dates. Power BI provides a set of Time Intelligence functions that make it easy to perform these types of calculations. But to take advantage of the Time Intelligence functions in Power BI, you must have a date table in your Power BI model and to have that you will need to “mark” a table as a date table.
To mark a table as a date table, it must meet the following criteria:
It must have a column of data type “Date” or “Date/time”. This will be referred to as the “date column”.
The date column must contain unique date values. For example, you cannot have the value “3/1/2022” (or any other date value) listed twice (or more than once) in the table.
The date column must not contain BLANKs or NULLs. Only unique date values should be in the table’s date column.
The date column must not have any missing dates or gaps in dates. For example, you cannot have 1/1/2022 and then 1/3/2022 and not have 1/2/2022 in the date values.
The date column must span full years. Keep in mind that a year isn’t necessarily a calendar year (January-December), but should cover the entire 12 months, such as all dates between July 1, 2022 – June 30, 2023, inclusive. If you have less than one year’s dates in your table, then the range can be less than a year, but there cannot be any gaps. Also,
Once these rules are met, you can then mark the table as the date table. To do this, you can either right-click on the table in the Data pane and select “Mark as date table” (as shown below):
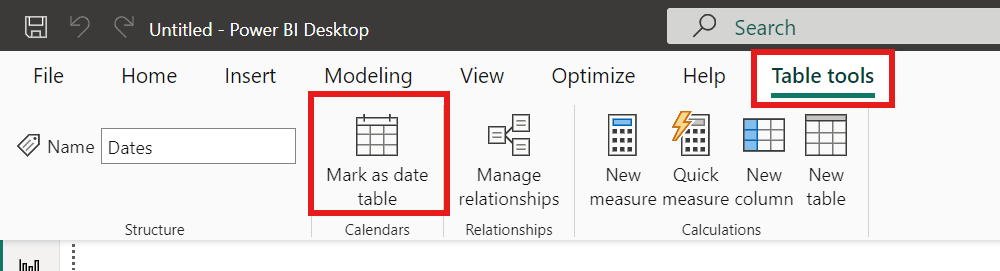
Or with the table selected in the Data pane, from the Table Tools tab, click on the “Mark as date table” icon. This icon will be grayed out if there are no date columns in the table.
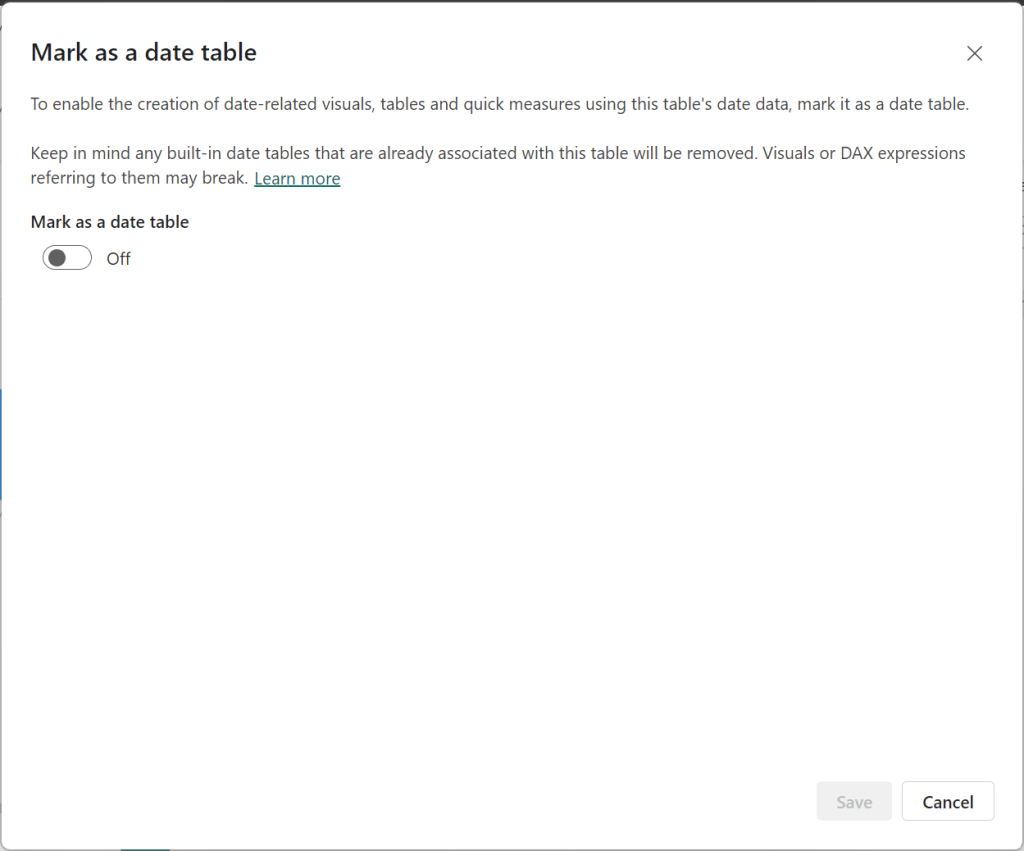
The “Mark as date table” dialog opens (which includes a warning), from which you can turn on the “Mark as date table” flag.
Turn on the flag, and then select / set the date column from the dropdown.
Power BI will then validate your data to make sure all the criteria is met for the chosen column. If you get an error, make the necessary changes and try again.
When working with data, you may need to add an index column (or an ID column) to your data. For example, you may have a list of products (names and descriptions) but you do not have an ID for each product, and you need to assign one to each product, perhaps for data modeling purposes.
To add an index or ID column to each row, you will do this in the Power Query Editor. With your query (table) open, go to the “Add Column” tab where you will see the “Index Column” option.
You can click the menu item to use its default option – which will add an index column that starts at zero (0) – as shown below.
Or you may click the dropdown (to the right of the Index Column menu item) to choose from 3 available options (From 0, From 1, or Custom).
“From 0” will add an index column that starts at zero (0) as shown above (in the default example).
“From 1” will add an index column that starts at one (1), as shown below:
“Custom” will open a dialog for you to enter the “Starting index” value and the “Increment” between each value. In the example below, the starting index value is set to 1000, and the increment is set to 5.
This means that the first value in the index column will be 1000, the second value will be 1005, the third 1010, and so on. This is shown below.
Once your index column is added, you can rename it and move it as desired. For example, you may rename the column name to Product ID and move the column to the front of the table as shown below.
Whether you need to create a small lookup table or you need data in a small table to test an idea or feature, you may have the need to manually or directly enter data into a table in Power BI. To do this you will use the “Enter Data” feature available in the “Home” tab/ribbon in the Power Query Editor.
Click the “Enter Data” ribbon icon. It will open the “Create Table” window (dialog) – shown below.
Enter the desired data, including the column names for as many columns as you need, and the values for as many rows as you need. However, typically this feature is used for small table (few columns and few rows). It is best to have larger data tables in a database or file. In the example below, 3 columns and 5 rows of office location information were entered.
Also, name the table appropriately. The table is named “Location” in the example above.
Once you are done entering the data and naming your table, click OK. The table will be added as a query. You can now use this table/query just like any other query in Power Query.
Update Data
After you have created the new query, how do you update the data? Whether you need to make a correction or an update to existing data or add new data, select the query, then in the “APPLIED STEPS” pane to the right, click on the gear icon in the “Source” step.
This will reopen the “Create Table” window from where you can add, delete, and update any of the records.
Power BI allows you to sort one column, such as a column displayed in a visual, by another, such as one that is not displayed. Here we will explain how this is done.
A very common case of this is with “Month Name”. You typically want to display the Month Name (Jan or January, …, Dec or December, etc.) and not the Month Number (1, 2, …, 12). And instead of sorting the month name alphabetically (Apr, Aug, Dec, …, Sep), typically you want to sort it chronologically (Jan, Feb, Mar, …, Dec).
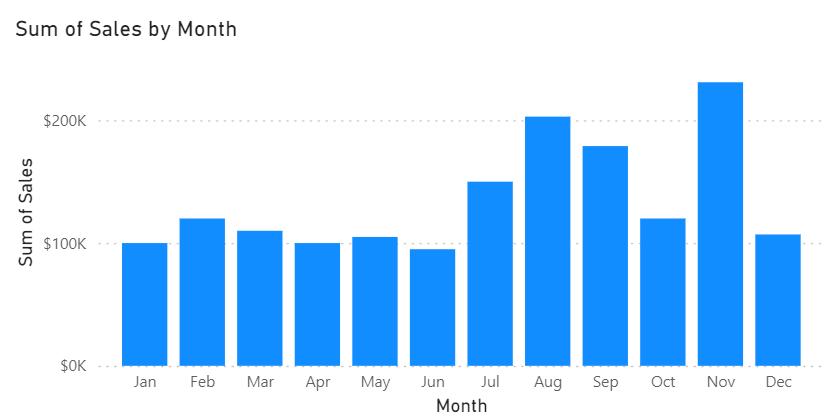
In this made-for-example scenario, you have Sales by Month, and when you sort by Month, it is displayed as shown below – as expected in alphabetical month order.
But as mentioned before, we really want the months sorted in chronological order. To do this, we need to sort the Month Name by the Month Number.
Click the “Month” field (month name) in the Data pane, and then click the “Sort by column” icon dropdown, and select “Month No” (month number). This is telling Power BI to sort the month (Month) by the month number (Month No), instead of the month name (Month).
So, now your Sales by Month visual with the same sorting will look like the below – sorted by month chronologically.
The employee life cycle, the journey of a person from “a potential candidate who applies for a job at a company at some point” to “becoming an employee of the company” to “eventually leaving the company”, consists of 6 stages. In this article I will describe the stages of the employee life cycle and will also describe a few metrics that can be used to evaluate how the organization is doing at each stage. These metrics will allow HR teams (and others) to understand how things are going at each stage so that they can make data-driven decisions to improve outcomes. As I described in more detail in another article, “What is HR / People / Workforce Analytics?”, examples of the “outcomes” that companies seek to improve, include but are not limited to: successful hiring, reduced costs, high employee engagement, reduced absences, high employee productivity, low turnover or high retention (especially of top talent), accurate staff forecasting, and attributable business impact.
While the metrics covered here are relevant in almost all companies, these are just examples of some of the possible metrics. There are many other metrics that a company could track, and other metrics may be more relevant in your organization, and you would therefore use those metrics to guide the management of the stages. The main idea here is to identify the metrics for each stage that are important to your organization and use them to help manage your life cycle using data and not just intuition.
Another thing to keep in mind is, you must have the relevant data to generate the metrics you are interested in tracking. Once you determine the metrics that are important to you, then you need to make sure the data needed to generate those metrics is available in some form, otherwise a plan must be devised to start generating, capturing, and storing the necessary data.
The Stages
The Employee Life Cycle has 6 stages. They are (1) Attracting/Recruitment, (2) Hiring, (3) Onboarding, (4) Development, (5) Engagement/Retention, and (6) Separation.
The Employee Life Cycle with its 6 stages
Each stage is important and, with the right data, can provide insight into how effective your organization is at making the best of its most important and valuable resource (its employees). Let’s take a look at each stage in more detail.
Stage 1: Attracting / Recruitment
The Attracting/Recruitment stage of The Employee Life Cycle
In this stage, organizations engage in indirect and direct efforts to attract and recruit candidates. Organizations will make efforts to build their brand as a great company and employer which will attract potential candidates with a desire to work there. They will also perform direct recruiting efforts such as job postings, job fairs, recruiting events, college outreach, and more. Companies generally desire to have a robust pool of potential candidates and a solid number of applicants for their open positions. It is important to know if you are attracting the right candidates, recruiting in the right places and with the best mediums, and using effective methods.
Below are a few metrics that can be used to analyze how things are going at this stage. You will use metrics relevant to tracking and meeting your company’s recruitment goals.
Attracting / Recruitment Metrics
Metric
Description and commentary
Average recruiting cost per hire
What the organization spends on average in recruitment to fill a position. If this number is too high, a company will need to find ways to lower the cost by implementing new recruiting methods or eliminating some methods.
Average length of hiring cycle
Measured from the date HR is asked to fill a position to the date the new hire starts the job. So, this metric spans more than just the recruitment stage. If this length of time is too long or has started trending in the wrong direction, the recruiting team can examine to determine where the delays are coming from and take necessary action if it turns out to be a result of the attracting/recruiting efforts.
On-time talent delivery factor
Average number of days that newly hired employees’ start dates differs from the need-by date listed on the requisition requesting the hire. If this metric shows that on-time delivery is low, then the team needs to examine things like … Are we attracting the wrong applicants or in other words, are we attracting quality candidates? Are our job postings effective? Are we recruiting with the right frequency and using the right mediums/methods?
Recruitment source ratio
This metric is calculated by: Internal hires/External hires This will shed light on if the company is “recruiting” internally, and also if they are developing internal people properly and encouraging internal mobility. A high Recruitment Source Ratio is a good sign that employees want to stay with the company and have opportunities for growth and mobility, which will help the company’s brand as an “employer of choice”.
Offer Acceptance Rate
What percentage of candidates accept job offers presented by the company. This is calculated by: Offers accepted/Offers made x 100. The aim is to get this number as close to 100% as possible. While this metric is most relevant in the Hiring stage, it is also important for team members that monitor the Recruitment stage to pay attention to this metric to determine if any changes need to be made in Recruiting before the person moves to the Hiring stage. For example, if this metric is too low, it might be relevant to investigate if Recruiting is setting the wrong expectations which don’t materialize for the candidate in the Hiring stage.
Internal Hire rate
The percentage of hires that are internal hires. This metric provides similar insights as the Recruitment Source Ratio metric and will let you know if your company is attracting qualified internal candidates for open positions and supporting internal mobility.
Number of applicants per job listing
The number of applicants applying to each job. This will shed light on your company’s recruiting power. It will also show which jobs may need unique recruiting approaches.
% of diverse applicants
The percentage of applicants that are diverse. This metric will help you to track if your recruiting efforts are supportive of your diversity goals.
Stage 2: Hiring
The Hiring stage of The Employee Life Cycle
This is where an organization interviews, selects, extends offers to, and hires candidates to join their staff. This is an important stage because hiring the “right” people is critical to the success of any company. But it’s also important to make sure that applicants not selected are also handled properly by the process.
Below are a few metrics that can be used to analyze how things are going at this stage. You will use metrics relevant to tracking and meeting your company’s hiring goals.
Hiring Metrics
Metric
Description and commentary
Headcount & Headcount demographics
The number of employees in the company; and the number of employees broken out by various demographic and organizational values. This helps a company to see if headcount is shrinking, growing, or stable, and if the headcount is within the company’s or division’s target ranges. This will also shed light on the diversity makeup of the employees across the company and across smaller org units within the company.
# of new hires
The number of new hires within some timeframe (month, quarter, year). This metric can help companies prepare for new employees. It may also lead to investigative questions like … why are we hiring so much? Or why has hiring dropped so much? This metric can also be analyzed in comparison to terminations, as in the Net Hire Ratio metric described below.
Time to hire
The time it takes from the job posting to a hire for the position. This is an indication of the strength of the company’s candidate pool and how efficient their recruiting and hiring processes are.
Offer acceptance rate
This metric was also included in the Recruitment stage. The percentage of candidates that accept job offers presented by the company. It is often calculated as: Offers accepted/Offers made x 100 The aim is to get this number as close to 100% as possible. If this number of low or trending down, the HR Teams can investigate to identify the causes and determine possible actions for improvement.
Net hire ratio
The ratio of the number of employees joining the organization to the number leaving. If this ratio is greater than 1 then more people are joining than those leaving, and it’s the opposite if this ratio is less than 1. It is calculated by: External hires/Terminations
New hire turnover contribution
This metric provides the percentage of total terminations that is attributable to the termination of short-tenure employees. If this number is high, then HR needs to examine recruiting, hiring, onboarding, and early development stages.
Performance of new hires in first year
This metric provides a measure of the performance of new hires. Implementing programs to drive high performance in new employees will reduce turnover and likely improve overall outcomes for the company.
New hire Turnover rate (3 months, 6 months, first year, 2 years)
This is a measure of the percentage of new hires that are leaving the company. And this should be tracked at various tenure marks and across relevant dimensions (such as your various orgs and jobs). This is another way to measure the quality of new hires and can be very useful to identify where you might be having a new hire turnover issue.
Cost per hire
This measures how much it is costing to hire each employee. Tracking this metric allows HR departments to easily recognize when they may need to make adjustments in the hiring process to reduce costs. This metric is also important for some ROI analyses.
Average cost of a bad hire
Measures the cost of hiring employees that did not work out. Breaking this down by department, position, and other dimensions is most useful and hits home with the importance of hiring “right”.
New hire satisfaction index
This metric measures if new hires are satisfied with their job. This metric’s data is usually derived from surveys. This metric will shed light on new hire turnover, and quality of hire metrics. This will help to identify if changes are needed in the recruiting, hiring, onboarding, or developments processes.
Manager satisfaction with new hires index
This metric measures the satisfaction of managers with new hires reporting to them. The data for this metric is usually derived from surveys. This metric can be compared to the “New hire satisfaction index” metric to see if these 2 perspectives are in sync or if they diverge. This will help to identify if changes are needed in the recruiting, hiring, onboarding, or developments processes.
Quality of hire
This is a measure of the value new hires bring to a company or in other words, a measure of whether new hires turned out to be good hires. How companies measure this will vary. Most will use tenure/turnover data, and some may also include employee performance data, and even employee and manager satisfaction data, and exit survey data.
Internal Hire rate
The percentage of hires that are internal hires. This metric will let you know if your company is attracting qualified internal candidates for open positions and supporting internal mobility.
% of new hires that are diverse
The percentage of new hires that are diverse. This metric will help you to track if you are meeting your diversity goals.
Stage 3: Onboarding
The Onboarding stage of the Employee Life Cycle
In this stage, an organization “onboards” newly hired employees. This includes setting up the new employees with access to buildings and networks, providing information about the company’s operations, culture, and more, and providing information about benefits, intranets, etc., and potentially introducing them to key leaders. The whole idea here is to transition the new employee into the company as smoothly as possible, with relevant knowledge to get started efficiently, and with the right expectations and mindset based on the company’s goals and culture. The first few weeks on the job is a very important phase and can “make or break” the success of new employees. It takes time to get new hires to be productive, and therefore, it’s very costly when an organization loses these new hires quickly.
Below are a few metrics that can be used to analyze how things are going at this stage. You will use metrics relevant to tracking and meeting your company’s onboarding goals.
Onboarding Metrics
Metric
Description and commentary
Onboarding satisfaction
The sentiment of new hires after the onboarding process is complete. This metric will usually be derived from survey data. Sometimes the satisfaction of the hiring managers is also tracked. This metric will shed light on whether changes are needed in the onboarding process.
New hire turnover (or new hire retention)
This metric provides the percentage of total terminations that is attributable to the termination of new or short-tenure employees, where the tenure term is usually tracked at various marks, such as 3 months, 6 months, and 1 year. If using the “retention” metric, then it’s the opposite, which is … the percentage of new employees that remain with the company. And this can also be tracked at various tenure marks.
Retention threshold
This metric tracks the threshold points at which employees are leaving. It may help to identify if you have a problem at specific tenure points, perhaps in specific roles or departments, which will allow a company to analyze more closely and determine what actions may help to address the situation.
Time to productivity
This is a measure of the time it takes to make an employee productive. This will vary by job and so it’s best to be able to measure and use it accordingly. This metric is useful for identifying what changes might be needed in the onboarding process to shorten this time. The metric can also be used for setting expectations for employees and managers.
Cost to productivity
This is the cost version of the “Time to productivity” metric. It is a measure of the costs involved in making an employee productive (cost of training and more). Similarly, this metric is useful for identifying what changes might be needed in the onboarding process to shorten this time and lower the costs.
Training completion rate
The percentage of employees completing their required training in the allotted time. Depending on the nature of the organization, this could be a critical metric and will shed light on what changes may be needed in the new employee training process or content.
Average onboarding costs per hire
The amount an organization spends on onboarding after filling a position with a new hire. This will help HR teams to determine if changes are needed to the process.
Stage 4: Development
The Development stage of the Employee Life Cycle
During this stage, organizations provide training and development opportunities for the employees including formal training, on the job training, documentation, opportunities to use new knowledge, mentoring, along with all other relevant pieces to help employees be as productive as possible in their jobs. The initial and ongoing development of employees is critical to the confidence, performance, and success of the employees on the job.
Below are a few metrics that can be used to analyze how things are going at this stage. You will use metrics relevant to tracking and meeting your company’s development goals.
Development Metrics
Metric
Description and commentary
Employee productivity
This is a measure of how productive employees are in their respective roles, and how productive employees are overall toward the goals and expectation of the company. This metric may shed light on, for example, if training is not effective or if additional trainings are needed, if the company’s culture is affecting performance, or if process or organizational changes are impacting employees, among other things. Anything negatively impacting productivity should be addressed with the highest priority.
Employee satisfaction with job/role
This metric identifies how satisfied employees are with their job. As you can imagine, unsatisfied employees lead to a whole set of issues, including the failure of the company to meet its goals. This is usually measured using surveys, one-on-one interactions, and potentially social media data. As with Employee Productivity, anything negatively impacting Employee Satisfaction should be addressed with the highest priority.
Employee performance
This is a measure of how employees are performing in their respective roles. This is similar to the “Employee productivity” metric. Are employees performing at or above expectations? If not, what can be done to improve the situation?
Training completion rate
A measure of the percentage of employees that are completing the required trainings. This may provide insight into questions like: Do we need to make changes to the training (content, delivery, timing)? Is there a correlation between completed training and job performance?
Training completion time
A measure of the time it takes to complete training. This metric will be a part of what makes up the “Time to productivity” metric. Monitoring this metric will provide insight into whether this metric is trending up or down, and what changes may be needed to the training programs.
Training effectiveness
A measure of how effective the new employee training is. Monitoring this metric will provide insight into what changes may be needed to the training programs.
Training expense per employee
A measure of how much training costs per employee. This metric will become a part of what makes up the “Cost to productivity” metric. This metric will be useful for identifying employee ROI. If this metric is trending up, it needs to be investigated to understand why and make adjustments as necessary.
Time to productivity
This metric is also in the Onboarding stage but for some jobs/companies, it goes beyond onboarding to get to full or acceptable productivity. This is a measure of the time it takes to make an employee productive. This will vary by job and so it’s best to be able to measure and use it accordingly. This metric is useful for identifying what changes might be needed in the onboarding and development stages to shorten the time. The metric can also be used for setting expectations for employees and managers.
Cost to productivity
This metric is also in the Onboarding stage but for some jobs/companies, it takes beyond onboarding to get to full or acceptable productivity. This is the cost version of the “Time to productivity” metric. It is a measure of the costs involved in making an employee productive (cost of training and more). Similarly, this metric is useful for identifying what changes might be needed in the onboarding and development stages to shorten the time and lower the costs.
Revenue per employee
This measures how much revenue the company generates per employee. Ideally, this metric should be trending up, but is acceptable to be going down during growth initiatives with lots of hiring. This metric will be useful for identifying employee ROI.
Stage 5: Engagement / Retention
The Engagement/Retention stage of the Employee Life Cycle
This is typically the longest stage of the employee life cycle, potentially spanning many years. In this stage, an organization will monitor the employees’ performance and provide competitive salaries, benefits, learning and development opportunities, growth opportunities, recognition, rewards such as bonuses, and take other steps to grow and retain effective employees. This stage could span years and includes many activities that need to be measured and monitored.
Below are a few metrics that can be used to analyze how things are going at this stage. You will use metrics relevant to tracking and meeting your company’s retention goals.
Engagement / Retention Metrics
Metric
Description and commentary
Retention rate
This measures the percentage of employees that stay with the company. It is the opposite of “Turnover rate”. It is often calculated as: (Starting headcount + external hires – terminations)/(Starting headcount + external hires) x 100
Key employee retention rate
This is the same as “Retention rate” but limited to those defined as key employees or high-performing employees or top-talent employees. Obviously, companies are most concerned about retaining their key talent. Any decline in the retention rate of key employees must be analyzed carefully and acted upon, if necessary, with a high priority.
Average retention period
Average amount of time employees stay in their positions (typically broken down by department and position). This metric can be analyzed alongside satisfaction and performance metrics.
This measures the percentage of employees leaving the organization. This metric is the opposite of “Retention rate”. It is often calculated as: (Terminations/Average headcount) x 100 And it is typically broken out by Voluntary and Involuntary Terminations. As with many other metrics, this will be most insightful when broken out by time, org (region, department, etc.), manager, termination reasons, and other dimensions.
Employee retention index
This metric measures how likely employees are to stay with the organization. The data for this metric typically comes from surveys. This metric sheds light on if changes are needed to the current retention efforts.
Employee satisfaction
This metric measures employee overall satisfaction. Employee satisfaction has a direct and significant impact on a company’s success. This is usually measured using surveys, one-on-one interactions, and potentially social media data. This measure should be tracked by org, and by role. And it should also be tracked with whether there have been recent major organizational or process changes.
Employee performance
This metric is also included in the Developing stage of the life cycle. This is a measure of how employees are performing in their respective roles. Are employees performing at or above expectations? If not, what can be done to improve the situation?
Talent turnover rate
This is the opposite of the “Key employee retention rate “ metric listed earlier, but measures turnover of key employees as opposed to retention of those employees. Obviously, companies are most concerned about reducing the turnover of their key talent.
Time since last promotion
The time since an employee was last promoted. This metric can provide insight into what impact promotions may have on areas such as turnover/retention, employee satisfaction, and performance.
Time since last salary increase
The time since an employee last received a salary increase. This metric may provide similar insights as the “Time since last promotion” metric. This metric can provide insight into what impact raises may have on areas such as turnover/retention, employee satisfaction, and performance.
Absence rate
This metric measures how often employees are absent from work. Like many other metrics, this will be most insightful when viewed by various dimensions, such as by org or by manager. High absence will undoubtedly impact the company’s overall performance and must be addressed when necessary.
Overtime hours
The is the amount of overtime hours worked by employees. A high amount of overtime is not necessarily bad, as it may be a result of business growth, but on the other hand, it may indicate problems with inefficient scheduling or overtime abuse. Another consideration is checking the impact overtime has on turnover and employee satisfaction.
Revenue per employee
This measures was also included in the “Development” stage of the life cycle. It measures how much revenue the company generates per employee. Ideally, this metric should be trending up, but is acceptable to be going down during growth initiatives. This metric will be useful for ROI analyses.
Time to resolution of HR cases
This measures how quickly HR cases are resolved. This can impact employee satisfaction and therefore, is important to track and monitor.
Stage 6: Separation
The Separation stage of the Employee Life Cycle
This is where the employee and the organization separate. The termination may be voluntary (the employee decided to leave the organization), or it may be involuntarily (the organization decided the employee must leave).
Below are a few metrics that can be used to analyze how things are going at this stage. You will use metrics relevant to tracking and meeting your company’s separation goals.
Metrics
Description and commentary
Turnover Rate (also called Attrition rate) Voluntary Turnover Rate or Voluntary Attrition Rate
This metric is also included in the Engagement/Retention stage. It measures the percentage of employees leaving the organization. It is often calculated as: (Terminations/Average headcount) x 100 And is typically broken out by Voluntary and Involuntary Terminations As with many other metrics, this will be most insightful when broken out by time, org (region, department, etc.), manager, termination reasons, and other dimensions.
Tenure
The length of time that an employee is with the company. Analyzing tenure by various dimensions and how it correlates with other metrics can lead to insights.
Overtime Hours
This metric is also included in the Engagement/Retention stage. It measures the amount of overtime hours worked by employees. A high amount of overtime could be a cause of employee dissatisfaction and lead to increased turnover. This should be asked in exit surveys, but also be tracked using hours worked data.
Employee performance
This metric is also included in the Development stage and the Engagement/Retention stage of the life cycle. This is a measure of how employees are performing in their respective roles. Are employees performing at or above expectations? Are we losing high performers or low performers?
Time since last promotion
This metric was also included in the Engagement/Retention stage. It is the time since an employee was last promoted. This metric can provide insight into what impact promotions may have on areas such as turnover/retention, employee satisfaction, and performance. Are employees quitting because of a lack of vertical career growth potential and going to other companies that are perceived to have such potential?
Time since last salary increase
This metric was also included in the Engagement/Retention stage. It may provide similar insights similar to the “Time since last promotion” metric. The time since an employee last received a salary increase. This metric can provide insight into what impact raises may have on areas such as turnover/retention, employee satisfaction, and performance. Are employees competitively paid? Are employees quitting to go to other jobs with higher pay?
Employee satisfaction
This metric was also included in the Engagement/Retention stage. It measures employee overall satisfaction. Employee satisfaction has a direct and significant impact on a company’s success. This is usually measured using surveys, one-on-one interactions, and potentially social media data. This measure should be tracked by org, and by role. And it should also be tracked with whether there have been recent major organizational or process changes.
Summary
We went through each stage of The Employee Life Cycle and a sampling of relevant metrics that can be used to manage each stage. Throughout the employee life cycle, the appropriate HR teams need to track and monitor the relevant metrics at each stage and use that information to continuously manage the processes toward improvement. Note that issues in one stage will sometimes affect other stages. For example, if a company develops a reputation of not investing in training for employees (Onboarding and Development stage) which leads to an inefficient and stressful work environment (Engagement/Retention), then this may also lead to higher-than-normal turnover (Separation stage) and may impact the company’s ability to attract and recruit top talent (Attracting/Recruitment stage), among other things.
Keep in mind that the above sets of metrics do not include all HR metrics. These are examples of some common metrics that are most likely relevant to a company, with their definitions and additional commentary to show how you can use metrics at each stage to better manage your HR processes and activities. There are many other HR metrics that may be more relevant to your company.
Also, remember that each metric (where it makes sense) should be analyzed across a variety of relevant dimensions. For example, just about all metrics should be analyzed over the dimension of time, because looking at turnover rates over all-of-time will not be as insightful as looking at it by month. Another example is, Employee Performance can be analyzed at the company level, but can be more insightful when analyzed by departments or by roles or both.
Thanks for reading! I hope you found this information useful.
Power BI allows us to connect to many different data sources – from relational databases, NoSQL databases, files, and more – to source data for consumption in Power BI. From the data sourced, you can create additional data (new calculated columns, metrics, transformed data, etc.), build data models, and create reports and dashboards.
There are a few storage modes related to how the data is retrieved, stored, and processed in Power BI. The storage modes are Import, DirectQuery, Live Connection, and Dual. The storage mode is set at the table level for each table in the Power BI data model. I will now describe these modes.
Import
With the Import storage mode, Power BI imports and caches the data from the sources. Once the data import is complete, the data in Power BI will remain the same until is refreshed by the Power BI refresh process for that dataset.
This storage mode allows for the usage of the most Power BI features for data modeling and analysis. For example, Import mode is required for using two of the popular Power BI features, Quick Insights and Q&A. Also, this mode is almost always the best for performance. However, it’s not necessarily the best option in all scenarios. Since the data is imported, the file size can get large and can sometimes take a considerable amount of time to load. But generally, for relatively static, low volume data, it is the preferred choice.
Queries submitted to an imported dataset will return data from the cached data only.
DirectQuery
With the DirectQuery storage mode, no data is cached in Power BI, but the metadata of the source tables, columns, data types, and relationships is cached. Instead, the data is directly queries on the source database when needed by a Power BI query, such as when a user runs a Power BI report that uses the data.
For Since the data is not imported, if all the tables in the data model use DirectQuery, the Power BI file size will be very small compared to a model with imported data.
Live Connection
The Live Connection storage mode is a special case of the DirectQuery mode. It is only available when sourcing from Power BI Service datasets or Analysis Services data models. There are limitations when using this mode. Data modeling is limited to creating measures, and therefore, you cannot apply transformations to the data, and you cannot define relationships within the data. And you can only have one data source in your data model.
Dual
With the Dual storage mode, a table may use Import mode or DirectQuery mode, depending on the mode of the other tables included in the query. For example, you may have a scenario in which you have a Date table that is connected to one transaction table that needs to reflect the data in the source, and is therefore set to DirectQuery mode, and also connected to another transaction table that only has less than 100,000 rows and is set to Import storage mode. By setting the Date table to Dual storage mode, Power BI will use DirectQuery when the query involves the date table and the first transaction table, while using Import mode when the query involves the date table and the second transaction table.
The below table summarizes the Power BI data storage modes:
Import
DirectQuery
Live Connection
Dual
-Data is imported and cached in Power BI
-Preferred for static, relatively small datasets
-All Power BI functionality is available – including DAX, Calculated tables, Q&A and Quick Insights
-Can connect to Analysis Services but Live Connection is preferred
-Can have unlimited data sources
-Typically provides the best performance
-Data is queried on the source when needed
-Use for large datasets and when data changes in source need to be updated immediately
-Features such as Q&A, Quick Insights, Calculated Tables, and many DAX queries are not supported
-Limited data transformation functionality
-Parent-child functionality not supported
-For relational databases
-Not supported for Analysis Services
-Performance greatly dependent on the source data source
-A special case of DirectQuery
-Used for connecting to multi-dimensional data sources, such as Analysis Services
-Can be used only with Power BI datasets and Analysis Services
-Can have only one data source
-No data transformation available
-Q&A and Quick Insights not available
-Can create measures
-A combination of Import and DirectQuery
-Power BI will choose the appropriate option based on the storage mode of the tables involved in the query
-Can improve performance
Summary of Power BI storage modes
Note: the content in this post is relevant for the PL-300 Analyzing Data with Microsoft Power BI certification exam.
Thanks for reading! I hope you found this information useful.
An organization’s most important resource is its staff. Understanding how to take the best care of your staff and help them to be highly engaged and productive is key to the success of the organization. HR Analytics / People Analytics / Workforce Analytics can help with this. But what is that exactly?
Analytics is a multi-disciplinary field that involves the collection and curation of data, and the analysis of that data using a variety of methods and tools, to discover, interpret and share information and insights, to help develop better business understanding and help guide decision making, usually toward achieving an organization’s goals. HR / People / Workforce Analytics is analytics around an organization’s candidates and staff, and HR actions and operations. The term most commonly used for this area of specialization by people in the field has shifted from HR Analytics to People Analytics over the years, and is now trending toward Workforce Analytics, so I will just use Workforce Analytics for the rest of the article.
The data used for Workforce Analytics will come from many sources inside and outside the organization including, but not limited to, Human Capital ERP systems, Workforce applications, Recruiting applications, Payroll applications, scheduling applications, employee and candidate surveys, social media, Glassdoor, and more. This data can be transformed, integrated and aggregated as appropriate, and then analyzed to provide information to help with operational and strategic decision making around areas such as staffing, recruiting, retention, turnover, absence, compensation and benefits, employee engagement, job satisfaction, performance and productivity, training and development, diversity, equity and inclusion, and operational efficiency, among others.
This analysis is usually performed across time periods (months, years) to allow for period-to-period comparisons and trend analysis to determine if the various metrics being measured and analyzed are improving or not. And the analysis is also usually done across all levels of the organization, so that information is available to support decision making for the entire organization or for a single department or for a specific segment of employees (such as all the clinical employees within a healthcare organization) or potentially for an individual employee.
The end goal usually includes helping with efforts such as:
Understanding the current workforce landscape and knowing any operational tasks that need to be performed
Hiring better candidates by predicting candidate success and reducing recruiting/hiring costs
Improve employee engagement through a better understanding of employee’s true needs, and what is working and what is not, and reducing absences as a result
Increase employee productivity through a better understanding of how employees work and things that slow them down
Reducing turnover by predicting employees at a high risk of turnover and implementing proactive retention measures
Forecast future staffing needs to better prepare for it with recruiting and training & development
Determining the business impact of HR initiatives
The diagram below summarizes the Workforce Analytics components to give you an overview of this article in a quick glance.
Of course, all organizations are different, and so the goals of an organization, the type of data available and the type of analyses of interest to an organization, will vary. But the importance and value of Workforce Analytics, which helps organizations make the most of their most important resource, is critical to just about all medium to large organizations, regardless of industry and prior success.
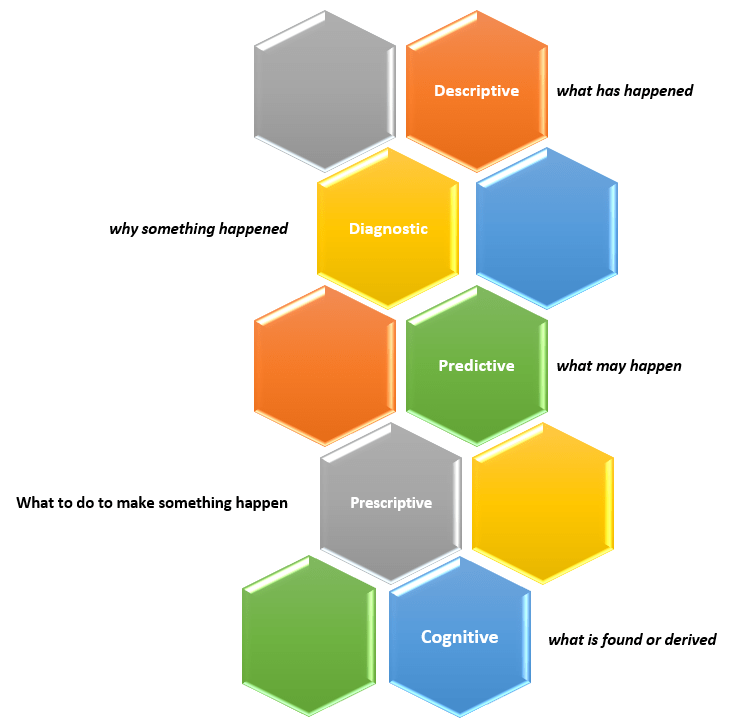
New capabilities and solutions have led to a new classification of analytics called Cognitive Analytics.
Cognitive Analytics involves bringing together technologies such as Artificial Intelligence (AI), Machine Learning (ML), and Deep Learning to apply human-like behavior to data tasks at unhuman scale, such as, searching through massive amounts of data and making sense of its contexts and be able to provide information from it, such as a likely answer or a sentiment score. This form of analytics provides new solutions that do not fit into any of the other four classifications and, in short, can be dubbed as “what is found or derived“.
There are many use cases that could benefit from this type of analytics, such as, personalization of services at scale, and improved customer service efficiency.
Thanks for reading and best wishes on your data journey!
Information and resources for the data professionals' community