Category: Business Intelligence

COUNT vs. COUNTA in Power BI DAX: When and How to Use Each

When building measures in Power BI using DAX, two commonly used aggregation functions are COUNT and COUNTA. While they sound similar, they serve different purposes and choosing the right one can prevent inaccurate results in your reports.

COUNT: Counting Numeric Values Only

The COUNT function counts the number of non-blank numeric values in a column.

DAX syntax:
COUNT ( Table[Column] )

Key characteristics of COUNT”:

  • Works only on numeric columns
  • Ignores blanks
  • Ignores text values entirely

When to use COUNT:

  • You want to count numeric entries such as:
    • Number of transactions
    • Number of invoices
    • Number of scores, quantities, or measurements
  • The column is guaranteed to contain numeric data

Example:
If Sales[OrderAmount] contains numbers and blanks, COUNT(Sales[OrderAmount]) returns the number of rows with a valid numeric amount.

COUNTA: Counting Any Non-Blank Values

The COUNTA function counts the number of non-blank values of any data type, including text, numbers, dates, and Boolean values.

DAX syntax:
COUNTA ( Table[Column] )

Key characteristics of “COUNTA”:

  • Works on any column type
  • Counts text, numbers, dates, and TRUE/FALSE
  • Ignores blanks only

When to use COUNTA:

  • You want to count:
    • Rows where a column has any value
    • Text-based identifiers (e.g., Order IDs, Customer Names)
    • Dates or status fields
  • You are effectively counting populated rows

Example:
If Customers[CustomerName] is a text column, COUNTA(Customers[CustomerName]) returns the number of customers with a non-blank name.

COUNT vs. COUNTA: Quick Comparison

FunctionCountsIgnoresTypical Use Case
COUNTNumeric values onlyBlanks and textCounting numeric facts
COUNTAAny non-blank valueBlanks onlyCounting populated rows

Common Pitfall to Avoid

Using COUNTA on a numeric column can produce misleading results if the column contains zeros or unexpected values. Remember:

  • Zero (0) is counted by both COUNT and COUNTA
  • Blank is counted by neither

If you are specifically interested in numeric measurements, COUNT is usually the safer and clearer choice.

In Summary

  • Use COUNT when the column represents numeric data and you want to count valid numbers.
  • Use COUNTA when you want to count rows where something exists, regardless of data type.

Understanding this distinction ensures your DAX measures remain accurate, meaningful, and easy to interpret.

Thanks for reading!

Power BI load error: load was cancelled by error in loading a previous table

You may run into this error when loading Power BI:

"load was cancelled by error in loading a previous table"

If you do get this error, keep scrolling down to see what the “inducing” error is. This message is an indication that there was an error previous to getting to the current table in the process. The real, initial error will be more descriptive. Start with resolving that error(s), and then this one will go away.

I hope you found this helpful.

Power BI refresh error: Column ‘X’ in table ‘Y’ contains blank values and this is not allowed for columns on the one-side of a many-to-one relationship or for columns that are used as the primary key of a table

I was getting this error message when I attempted to refresh a Power BI application:

"Column 'Date' in table 'Date Dim' contains blank values and this is not allowed for columns on the one-side of a many-to-one relationship or for columns that are used as the primary key of a table"

However, despite what the message indicated, I double-checked and confirmed that I did not have any blank values in the ‘Date Dim’ table.

It turns out that you may also get this error (although incorrectly worded in my opinion) if the blanks are in the joining table. In my case, I had blanks in a ‘Snapshot Date’ column in the fact table that was joined to the ‘Date Dim’ table. Once these blanks were filled, the refresh ran without error.

One thing to look out for in these cases (since this is what happened in my case), if your source is Excel, undo all filters to make sure that you do not have any rows being filtered out when checking for blanks values across your columns, because this could potentially inadvertently hide the rows with the blank values and cause you to miss them.

I hope you found this helpful.

Developing metrics for your analytics project

When starting an analytics project, one of the most important decisions you will make is identifying the right metrics. Metrics serve as the compass for the initiative—they show whether you are on the right track, communicate achievements, highlight challenges, uncover blind spots, and ultimately, along with guiding future decisions, they demonstrate the value of the project to stakeholders. But designing metrics is not as simple as picking a single “success number.” To truly guide decision-making, you need a holistic set of measures that reflect multiple dimensions of performance.

Why a Holistic View Matters

Analytics projects sometimes fall into the trap of focusing on only one type of metric. For example, a project might track quantity (e.g., number of leads generated) while ignoring quality (e.g., lead conversion rate). Or it may measure cost savings but fail to consider user satisfaction, leading to short-term wins but long-term disengagement.

Develop Metrics from Multiple Dimensions

To avoid this pitfall, it’s critical to develop a balanced framework that includes multiple perspectives:

  • Quantity: How much output is produced? Examples include number of units produced, sales revenue, or number of new customers added.
  • Quality: What is the quality of the output? Examples include accuracy rates, defect counts, or error percentages.
  • Time: How long does it take to achieve the output? Or in other words, what timeframe is the quantity and quality measured over? Is it Sales revenue per hour, per day, per month, or per year?
  • Costs: What resources are being consumed? Metrics might include infrastructure costs, labor hours and costs, materials costs, or overall project spend.
  • Satisfaction: How do stakeholders, customers, or employees feel about the results? Feedback surveys, adoption rates, product ratings, and net promoter scores (NPS) are common ways of identifying this information.

Each of these perspectives contributes to the full story of your analytics project. If one dimension is missing, you risk optimizing for one outcome at the expense of another.

Efficiency, Effectiveness, and Impact Metrics

Another way you can classify your metrics to achieve a holistic view is with three overarching categories: Efficiency, Effectiveness, and Impact.

  • Efficiency Metrics
    • These measure how well resources are used and answers “are we doing things right?“. They focus on inputs versus outputs.
      • Example: “Average work hours per product” shows how quickly work gets done.
      • Example: “Cost per customer acquired” reflects the efficiency of your sales operations.
    • Efficiency metrics often tie directly to quantity, cost, and time.
  • Effectiveness Metrics
    • These measure how well goals are achieved—whether the project delivers the intended results, and answers “are we doing the right things?“.
      • Example: “Customer satisfaction” demonstrates how happy customers are with our products and services.
      • Example: “Actual to Target” shows how things are tracking compared to the goals that were set.
    • Effectiveness metrics often involve quality, satisfaction, and time.
  • Impact Metrics
    • These measure the broader business or organizational outcomes influenced by some activity.
      • Example: “Market share and revenue growth” shows financial state from a broader market and overall standpoint.
      • Example: “Return on Investment (ROI)” is the ultimate metrics for financial performance.
    • Impact metrics communicates how we are doing with our long-term, strategic goals. They often combine quantity, quality, satisfaction, and time dimensions.

The Significance of the Time Dimension

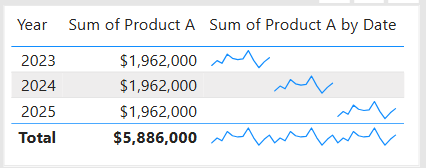
Among all the dimensions used in metrics, time is especially powerful because it adds critical context to nearly every metric. Without time, numbers can be misleading. Just about all metrics are more relevant when the time component is added. Time transforms static measures into dynamic insights. For instance:

  • A quantity metric of “100 new customers” becomes far more meaningful when paired with “this month” versus “since company founding.”
  • A quality metric of “95% data accuracy” is less impressive if it takes weeks to achieve, compared to real-time cleansing.
  • A cost metric of “$100,000 project spend” raises different questions depending on whether it’s a one-time investment or a recurring monthly expense.

By always asking, “Over what time frame?”, you unlock a truer understanding of performance. In short, the time dimension transforms static measures into dynamic insights. It allows you to answer not just “What happened?” but also “When did it happen?”, “How long did it take?”, and “How is it changing over time?”—questions that are generally crucial for actionable decision-making.

Time adds context to every other metric. Think of it as the axis that brings your measures to life. Quantity without time tells you how much, but not how fast. Quality without time shows accuracy, but not whether results are timely enough to act upon. Costs without time hide the pace at which expenses accumulate. And satisfaction without time misses whether perceptions improve, decline, or stay consistent over an initiative’s lifecycle.

The Significance of the Timeliness

Another important consideration is timeliness. Metrics must be accessible to decision makers in a timely manner to allow them to make timely decisions. For example:

  • A metric may deliver accurate insights, but if it takes three weeks to refresh the data and the dashboard that displays it, the value erodes.
  • A machine learning model may predict outcomes with high accuracy, but if the scoring process delays operational decisions, the benefit diminishes.

Therefore, in addition to deciding on and building the metrics for a project, the delivery mechanism of the metrics (such as a dashboard) must also be thought out to ensure that the entire process, from data sourcing to aggregations to dashboard refresh for example, can all happen in a timely manner to, in turn, make the metrics available to users in a timely manner.

Putting It All Together

When developing metrics for your analytics project, take a step back and ensure you have a comprehensive, multi-angle approach, by asking:

  • Do we know how much is being achieved/produced (quantity)?
  • Do we know how well it is being achieved/produced (quality)?
  • Do we know how fast results are being delivered (time)?
  • Do we know how much it costs to achieve (costs)?
  • Do we know how it feels to those affected (satisfaction)?
  • Do we know whether we are efficiently using resources?
  • Do we know whether we are effective in reaching goals?
  • Do we know what impact this work is having on the organization?
  • And for the above questions, always get a perspective on time … when? over what timeframe?
  • When are updates to the metrics needed by (real-time, hourly, daily, weekly, monthly, etc.)?

By building metrics across these dimensions, you create a more reliable, meaningful, and balanced framework for measuring success. More importantly, you ensure that the analytics project supports not only the immediate technical objectives but also the broader organizational goals.

Thanks for reading! Good luck on your analytics journey!

Choosing the Right Chart to display your data in Power BI or any other analytics tool

Data visualization is at the heart of analytics. Choosing the right chart or visual can make the difference between insights that are clear and actionable, and insights that remain hidden. There are many visualization types available for showcasing your data, and choosing the right ones for your use cases is important. Below, we’ll walk through some common scenarios and share information on the charts best suited for them, and will also touch on some Power BI–specific visuals you should know about.

1. Showing Trends Over Time

When to use: To track how a measure changes over days, months, or years.

Best charts:

  • Line Chart: The classic choice for time series data. Best when you want to show continuous change. In Power BI, the line chart visual can also be used for forecasting trends.
  • Area Chart: Like a line chart but emphasizes volume under the curve—great for cumulative values or when you want to highlight magnitude.
  • Sparklines (Power BI): Miniature line charts embedded in tables or matrices. Ideal for giving quick context without taking up space.

2. Comparing Categories

When to use: To compare values across distinct groups (e.g., sales by region, revenue by product).

Best charts:

  • Column Chart: Vertical bars for category comparisons. Good when categories are on the horizontal axis.
  • Bar Chart: Horizontal bars—useful when category names are long or when ranking items. Is usually a better choice than the column chart when there are many values.
  • Stacked Column/Bar Chart: Show category totals and subcategories in one view. Works for proportional breakdowns, but can get hard to compare across categories.

3. Understanding Relationships

When to use: To see whether two measures are related (e.g., advertising spend vs. sales revenue).

Best charts:

  • Scatter Chart: Plots data points across two axes. Useful for correlation analysis. Add a third variable with bubble size or color to generate more insights. This chart can also be useful for identifying anomalies/outliers in the data.
  • Line & Scatter Combination: Power BI lets you overlay a line for trend direction while keeping the scatter points.
  • Line & Bar/Column Chart Combination: Power BI offers some of these combination charts also to allow you to relate your comparison measures to your trend measures.

4. Highlighting Key Metrics

Sometimes you don’t need a chart—you just want a single number to stand out. These types of visuals are great for high-level executive dashboards, or for the summary page of dashboards in general.

Best visuals in Power BI:

  • Card Visual: Displays one value clearly, like Total Sales.
  • KPI Visual: Adds target context and status indicator (e.g., actual vs. goal).
  • Gauge Visual: Circular representation of progress toward a goal—best for showing percentages or progress to target. For example, Performance Rating score shown on the scale of the goal.

5. Distribution Analysis

When to use: To see how data is spread across categories or ranges.

Best charts:

  • Column/Bar Chart with bins: Useful for creating histograms in Power BI.
  • Box-and-Whisker Chart (custom visual): Shows median, quartiles, and outliers.
  • Pie/Donut Charts: While often overused, they can be effective for showing composition when categories are few (ideally 3–5). For example, show the number and percentage of employees in each department.

6. Spotting Problem Areas

When to use: To identify anomalies or areas needing attention across a large dataset.

Best charts:

  • Heatmap: A table where color intensity represents value magnitude. Excellent for finding hot spots or gaps. This can be implemented in Power BI by using a Matrix visual with conditional formatting in Power BI.
  • Treemap: Breaks data into rectangles sized by value—helpful for hierarchical comparisons and for easily identifying the major components of the whole.

7. Detail-Level Exploration

When to use: To dive into raw data while keeping formatting and hierarchy.

Best visuals:

  • Table: Shows granular row-level data. Best for detail reporting.
  • Matrix: Adds pivot-table–like functionality with rows, columns, and drill-down. Often combined with conditional formatting and sparklines for added insight.

8. Part-to-Whole Analysis

When to use: To see how individual parts contribute to a total.

Best charts:

  • Stacked Charts: Show both totals and category breakdowns.
  • 100% Stacked Charts: Normalize totals so comparisons are by percentage share.
  • Treemap: Visualizes hierarchical data contributions in space-efficient blocks.

Quick Reference: Which Chart to Use?

ScenarioBest Visuals
Tracking trends, forecasting trendsLine, Area, Sparklines
Comparing categoriesColumn, Bar, Stacked
Showing relationshipsScatter, Line + Scatter, Line + Column/Bar
Highlighting metricsCard, KPI, Gauge
Analyzing distributionsHistogram (columns with bins), Box & Whisker, Pie/Donut (for few categories)
Identifying problem areasHeatmap (Matrix with colors), Treemap, Scatter
Exploring detail dataTable, Matrix
Showing part-to-wholeStacked Column/Bar, 100% Stacked, Treemap, Pie/Donut

The below graphic shows the visualization types available in Power BI. You can also import additional visuals by clicking the “3-dots” (get more visuals) at the bottom of the visualization icons.

Summary

Power BI, and other BI/analytics tools, offers a rich set of visuals, each designed to represent data in a way that suits a specific set of analytical needs. The key is to match the chart type with the story you want the data to tell. Whether you’re showing a simple KPI, uncovering trends, or surfacing problem areas, choosing the right chart ensures your insights are clear, actionable, and impactful. In addition, based on your scenario, it can also be beneficial to get feedback from the user population on what other visuals they might find useful or what other ways they would they like to see the data.

Thanks for reading! And good luck on your data journey!

Microsoft Fabric OneLake Catalog – description and links to resources

What is OneLake Catalog?

Microsoft Fabric OneLake Catalog is the next generation, enhanced version of the OneLake Data Hub. It provides a complete solution in a central location for team members (data engineers, data scientists, analysts, business team members, and other stakeholders) to browse, manage, and govern all their data from a single, intuitive location. It provides an intuitive and efficient user interface and truly simplifies and transforms the way we can manage, explore, and utilize content in Fabric. Usage is contextual and it has unified all Fabric item types (including Power BI items) and expanded support to all Fabric item types, integrating experiences, and providing detailed views of data subitems. It is a great tool.

Why use OneLake Catalog?

This tool will make your work within Fabric easier, and it will reduce duplication of items due to improved discoverability, and it will enhance our ability to govern data objects within the platform. So, check out the resources below to learn more.

Here is a link to a detailed Microsoft blog post introducing the OneLake Catalog:

And here is a link to a Microsoft Learn OneLake Catalog overview:

And finally, this is a link to a great, short (less than 5 min) video that gives an overview of the OneLake Catalog:

Thanks for reading! Good luck on your data journey!

Why can’t I download my report from Power BI Service to a pbix file?

You might be attempting to download a report from the Power BI Service to a pbix file and do not see that option or that option is not active or selectable. The reason you cannot select the option is most likely because the report was created in the Power BI Service as opposed to using the Power BI Desktop.

When a report is created in the Power BI Service, you are not able to download that report to a Power BI pbix file. That option is only available when you create the report using the Power BI Desktop and then publish it to the Power BI Service.

Thanks for reading!

Activating or Deactivating “Preview Features” in Power BI

Microsoft frequently adds new features that are available for preview in Power BI. This is a way for Microsoft to launch the features and have them tested by the community before making them fully available in the Power BI application. These features are sometimes in preview mode for a long time, and you may find that you want to use one or more of these features before they become generally available.

To activate (or deactivate) preview features, go to … File –> Options and settings –> Options

Then, in the Options window, select “Preview features” (on the left) as shown below.

Then, select the options you would like to activate or deactivate on the right side, such as checking “Shape map visual” to activate it or unchecking “Sparklines” to deactivate it. Once you have selected or unselected all the features you want, then click “OK”. Then, make sure to save whatever you need to, and then close and reopen Power BI for the activations or deactivations to take effect.

Thanks for reading.

Data Cleaning methods

Data cleaning is an essential step in the data preprocessing pipeline when preparing data for analytics or data science. It involves identifying and correcting or removing errors, inconsistencies, and inaccuracies in the dataset to improve its quality and reliability. It is essential that data is cleaned before being used in analyses, reporting, development or integration. Here are some common data cleaning methods:

Handling missing values:

  • Delete rows or columns with a high percentage of missing values if they don’t contribute significantly to the analysis.
  • Impute missing values by replacing them with a statistical measure such as mean, median, mode, or using more advanced techniques like regression imputation or k-nearest neighbors imputation.

Handling categorical variables:

  • Encode categorical variables into numerical representations using techniques like one-hot encoding, label encoding, or target encoding.

Removing duplicates:

  • Identify and remove duplicate records based on one or more key variables.
  • Be cautious when removing duplicates, as sometimes duplicated entries may be valid and intentional.

Handling outliers:

  • Identify outliers using statistical methods like z-scores, box plots, or domain knowledge.
  • Decide whether to remove outliers or transform them based on the nature of the data and the analysis goals.

Correcting inconsistent data:

  • Standardize data formats: Convert data into a consistent format (e.g., converting dates to a specific format).
  • Resolve inconsistencies: Identify and correct inconsistent values (e.g., correcting misspelled words, merging similar categories).

Dealing with irrelevant or redundant features:

  • Remove irrelevant features that do not contribute to the analysis or prediction task.
  • Identify and handle redundant features that provide similar information to avoid multicollinearity issues.

Data normalization or scaling:

  • Normalize numerical features to a common scale (e.g., min-max scaling or z-score normalization) to prevent certain features from dominating the analysis due to their larger magnitudes.

Data integrity issues:

Finally, you need to address data integrity issues.

  • Check for data integrity problems such as inconsistent data types, incorrect data ranges, or violations of business rules.
  • Resolve integrity issues by correcting or removing problematic data.

It’s important to note that the specific data cleaning methods that need to be applied to a dataset will vary depending on the nature of the dataset, the analysis goals, and domain knowledge. It’s recommended to thoroughly understand the data and consult with domain experts when preparing to perform data cleaning tasks.

Add a “Last Refreshed Date” notification on a Power BI dashboard

It is customary to add a “Last Refreshed Date” to dashboards to notify users of when the dashboard was last refreshed. Here will go through the steps of adding a “Last Refreshed Date” to a Power BI dashboard.

Open the dashboard you want to add the notification to in Power BI Desktop, and then Get Date -> Blank Query. Name the new query as “Last Refreshed Date” or something like that.

Then, set the value as shown below, by typing “= DateTime.LocalNow()” into the formula area:

Next, convert the value to a Table by clicking the “To Table” icon, and then clicking the “To table” option:

A table with the single date column is created

Set the data type as Date/Time …

… and rename the column to something meaningful, such as “Last Refreshed Date” …

Close and apply your changes.

The table will be added to your Power BI model. It should have no relationships.

Now, add a Card visual to your dashboard, place it where it is visible but out of the way, such as in the top-right or bottom-right corner, and add the Last Refreshed Date column to it from the new table. Now, whenever your dashboard is refreshed, this new table and visual will also be updated/refreshed.

Thanks for reading!