
Category: Data Development

Choose Between Direct Lake on OneLake and Direct Lake on SQL Endpoints

This post is a part of the DP-600: Implementing Analytics Solutions Using Microsoft Fabric Exam Prep Hub; and this topic falls under these sections: 
Implement and manage semantic models (25-30%)
--> Optimize enterprise-scale semantic models
--> Choose between Direct Lake on OneLake and Direct Lake on SQL endpoints

In Microsoft Fabric, Direct Lake is a high-performance semantic model storage mode that allows Power BI and Fabric semantic models to query data directly from OneLake without importing it into VertiPaq. When implementing Direct Lake, you must choose where the semantic model reads from, either:

  • Direct Lake on OneLake
  • Direct Lake on SQL endpoints

Understanding the differences, trade-offs, and use cases for each option is critical for optimizing enterprise-scale semantic models, and this topic appears explicitly in the DP-600 exam blueprint.


Direct Lake on OneLake

What It Is

Direct Lake on OneLake connects the semantic model directly to Delta tables stored in OneLake, bypassing SQL engines entirely. Queries operate directly on Parquet/Delta files using the Fabric Direct Lake engine.

Key Characteristics

  • Reads Delta tables directly from OneLake
  • No dependency on a SQL query engine
  • Near-Import performance with zero data duplication
  • Minimal latency between data ingestion and reporting
  • Requires supported Delta table structures and data types

Advantages

  • Best performance for large-scale analytics
  • Always reflects the latest data written to OneLake
  • Eliminates Import refresh overhead
  • Ideal for lakehouse-centric architectures

Limitations

  • Some complex DAX patterns may cause fallback
  • Requires schema compatibility with Direct Lake
  • Less flexibility for SQL-based transformations

Typical Use Cases

  • Enterprise lakehouse analytics
  • High-volume fact tables
  • Near-real-time reporting
  • Fabric-native data pipelines

Direct Lake on SQL Endpoints

What It Is

Direct Lake on SQL endpoints connects the semantic model to the SQL analytics endpoint of a Lakehouse or Warehouse, while still using Direct Lake storage mode behind the scenes.

Instead of reading files directly, the semantic model relies on the SQL endpoint to expose the data.

Key Characteristics

  • Queries go through the SQL endpoint
  • Still benefits from Direct Lake storage
  • Enables SQL views and transformations
  • Slightly higher latency than pure OneLake access

Advantages

  • Supports SQL-based modeling (views, joins, calculated columns)
  • Easier integration with existing SQL logic
  • Familiar experience for SQL-first teams
  • Useful when business logic is already defined in SQL

Limitations

  • Additional query layer may impact performance
  • Less efficient than direct file access
  • SQL endpoint availability becomes a dependency

Typical Use Cases

  • Organizations with strong SQL development practices
  • Reuse of existing SQL views and transformations
  • Gradual migration from Warehouse or SQL models
  • Mixed BI and ad-hoc SQL workloads

Key Comparison Summary

AspectDirect Lake on OneLakeDirect Lake on SQL Endpoint
Data accessDirect file accessVia SQL analytics endpoint
PerformanceHighestSlightly lower
SQL dependencyNoneRequired
Schema flexibilityLowerHigher
Transformation styleLakehouse / SparkSQL-based
Ideal forScale & performanceSQL reuse & flexibility

Choosing Between the Two (Exam-Focused Guidance)

On the DP-600 exam, questions typically focus on architectural intent and performance optimization:

Choose Direct Lake on OneLake when:

  • Performance is the top priority
  • Data is already modeled in Delta tables
  • You want the simplest, most scalable architecture
  • Near-real-time analytics are required

Choose Direct Lake on SQL endpoints when:

  • You need SQL views or transformations
  • Existing logic already exists in SQL
  • Teams are more comfortable with SQL than Spark
  • Some flexibility is preferred over maximum performance

Exam Tip 💡

If a question emphasizes:

  • Maximum performance, minimal latency, or scalability/large-scale analyticsDirect Lake on OneLake
  • SQL views, SQL transformations, or SQL reuseDirect Lake on SQL endpoints

Expect scenario-based questions where both options are technically valid, but only one best aligns with the business and performance requirements.


Practice Questions:

Here are 10 questions to test and help solidify your learning and knowledge. As you review these and other questions in your preparation, make sure to …

  • Identifying and understand why an option is correct (or incorrect) — not just which one
  • Look for and understand the usage scenario of keywords in exam questions to guide you
  • Expect scenario-based questions rather than direct definitions

Question 1

A company has Delta tables stored in OneLake and wants the lowest possible query latency for Power BI reports without using SQL views. Which option should they choose?

A. Import mode
B. DirectQuery on SQL endpoint
C. Direct Lake on SQL endpoint
D. Direct Lake on OneLake

Correct Answer: D

Explanation:
Direct Lake on OneLake reads Delta tables directly from OneLake without a SQL layer, delivering the best performance and lowest latency.


Question 2

Which requirement would most strongly favor Direct Lake on SQL endpoints over Direct Lake on OneLake?

A. Maximum performance
B. Real-time data visibility
C. Use of SQL views for business logic
D. Minimal infrastructure dependencies

Correct Answer: C

Explanation:
Direct Lake on SQL endpoints allows semantic models to consume SQL views and transformations, making it ideal when business logic is defined in SQL.


Question 3

What is a key architectural difference between Direct Lake on OneLake and Direct Lake on SQL endpoints?

A. Only OneLake supports Delta tables
B. SQL endpoints require data import
C. OneLake access bypasses the SQL engine
D. SQL endpoints cannot be used with semantic models

Correct Answer: C

Explanation:
Direct Lake on OneLake reads Delta files directly from storage, while SQL endpoints introduce an additional SQL query layer.


Question 4

A Fabric semantic model uses Direct Lake on OneLake. Under which condition might it fallback to DirectQuery?

A. The model contains calculated columns
B. The dataset exceeds 1 TB
C. The Delta table schema is unsupported
D. The SQL endpoint is unavailable

Correct Answer: C

Explanation:
If the Delta table schema or data types are not supported by Direct Lake, Fabric automatically falls back to DirectQuery.


Question 5

Which scenario is best suited for Direct Lake on SQL endpoints?

A. High-volume streaming telemetry
B. SQL-first team reusing existing warehouse views
C. Near-real-time dashboards on raw lake data
D. Large fact tables optimized for scan performance

Correct Answer: B

Explanation:
Direct Lake on SQL endpoints is ideal when teams rely on SQL views and want to reuse existing SQL logic.


Question 6

Which statement about performance is most accurate?

A. SQL endpoints always outperform OneLake
B. OneLake always requires Import mode
C. Direct Lake on OneLake typically offers better performance
D. Direct Lake on SQL endpoints does not use Direct Lake

Correct Answer: C

Explanation:
Direct Lake on OneLake avoids the SQL layer, resulting in faster query execution in most scenarios.


Question 7

A Power BI model must reflect new data immediately after ingestion into OneLake. Which option best supports this requirement?

A. Import mode
B. DirectQuery
C. Direct Lake on SQL endpoint
D. Direct Lake on OneLake

Correct Answer: D

Explanation:
Direct Lake on OneLake reads data directly from Delta tables and reflects changes immediately without refresh.


Question 8

Which dependency exists when using Direct Lake on SQL endpoints that does not exist with Direct Lake on OneLake?

A. Delta Lake support
B. VertiPaq compression
C. SQL analytics endpoint availability
D. Semantic model compatibility

Correct Answer: C

Explanation:
Direct Lake on SQL endpoints depends on the SQL analytics endpoint being available, while OneLake access does not.


Question 9

From a DP-600 exam perspective, which factor most often determines the correct choice between these two options?

A. Dataset size alone
B. Whether SQL transformations are required
C. Number of report users
D. Power BI license type

Correct Answer: B

Explanation:
Exam questions typically focus on whether SQL logic (views, joins, transformations) is needed, which drives the choice.


Question 10

You are designing an enterprise semantic model focused on scalability and minimal complexity. The data is already curated as Delta tables. What is the best choice?

A. Import mode
B. DirectQuery on SQL endpoint
C. Direct Lake on SQL endpoint
D. Direct Lake on OneLake

Correct Answer: D

Explanation:
Direct Lake on OneLake offers the simplest architecture with the highest scalability and performance when Delta tables are already prepared.

Configure version control for a workspace in Microsoft Fabric

This post is a part of the DP-600: Implementing Analytics Solutions Using Microsoft Fabric Exam Prep Hub; and this topic falls under these sections: 
Maintain a data analytics solution
--> Maintain the analytics development lifecycle
--> Configure version control for a workspace

Version control in Microsoft Fabric enables teams to track changes, collaborate safely, and manage the lifecycle of analytics assets using source control practices. Fabric integrates workspace items with Git repositories, bringing DevOps discipline to analytics development.

For the DP-600 exam, you should understand how Git integration works in Fabric, what items are supported, how changes flow, and common governance scenarios.

What Is Workspace Version Control in Fabric?

Workspace version control allows you to:

  • Connect a Fabric workspace to a Git repository
  • Store item definitions as code artifacts
  • Track changes through commits, branches, and pull requests
  • Support collaborative and auditable development

This capability is often referred to as Git integration for Fabric workspaces.

Supported Source Control Platform

Microsoft Fabric supports:

  • Azure DevOps (ADO) Git repositories

Key points:

  • GitHub support is limited or evolving (exam questions typically reference Azure DevOps)
  • Repositories must already exist
  • Authentication is handled via Microsoft Entra ID

Exam note: Expect Azure DevOps to be the default answer unless stated otherwise.

What Items Can Be Version Controlled?

Common Fabric items that support version control include:

  • Semantic models
  • Reports
  • Lakehouses
  • Warehouses
  • Notebooks
  • Data pipelines
  • Dataflows Gen2

Items are serialized into files and folders in the Git repo, allowing:

  • Diffing
  • History tracking
  • Rollbacks

How to Configure Version Control for a Workspace

At a high level, the process is:

  1. Open the Fabric workspace settings
  2. Enable Git integration
  3. Select:
    • Azure DevOps organization
    • Project
    • Repository
    • Branch
  4. Choose a workspace folder structure
  5. Initialize synchronization

Once configured:

  • Workspace changes can be committed to Git
  • Repo changes can be synced back into the workspace

How Changes Flow Between Workspace and Git

From Workspace to Git

  • Users make changes in Fabric (e.g., update a report)
  • Changes are committed to the connected branch
  • Commit history tracks who changed what and when

From Git to Workspace

  • Changes merged into the branch can be pulled into Fabric
  • Enables controlled deployment across environments

Important exam concept:
Synchronization is not automatic—users must explicitly commit and sync.

Branching and Environment Strategy

A common lifecycle pattern:

  • Development workspace → linked to a dev branch
  • Test workspace → linked to a test branch
  • Production workspace → linked to a main branch

This supports:

  • Code reviews
  • Pull requests
  • Controlled promotion of changes

Permissions and Governance Considerations

To configure and use version control:

  • Users need sufficient workspace permissions (typically Admin or Member)
  • Users also need Git repository access
  • Git permissions are managed outside Fabric

Version control complements—but does not replace:

  • Workspace-level access controls
  • Item-level permissions
  • Endorsements and sensitivity labels

Benefits of Version Control in Fabric

Version control enables:

  • Collaboration among multiple developers
  • Change traceability and auditability
  • Rollback of problematic changes
  • CI/CD-style deployment patterns
  • Alignment with enterprise DevOps practices

These benefits are a frequent theme in DP-600 scenario questions.

Common Exam Scenarios

You may be asked to:

  • Identify when Git integration is appropriate
  • Choose the correct platform for source control
  • Understand how changes move between Git and Fabric
  • Design a dev/test/prod workspace strategy
  • Troubleshoot why changes are not reflected (sync not performed)

Example:

Multiple developers need to work on the same semantic model with change tracking.
Correct concept: Configure workspace version control with Git.

Key Exam Takeaways

  • Fabric supports Git-based version control at the workspace level
  • Azure DevOps is the primary supported platform
  • Changes require explicit commit and sync
  • Version control supports structured development and deployment
  • It is a core part of the analytics development lifecycle

Exam Tips

  • If a question mentions tracking changes, collaboration, rollback, or DevOps practices, think workspace version control with Git.
  • If it mentions moving changes between environments, think branches and multiple workspaces.
  • Know who can configure it → Workspace Admins
  • Understand Git integration flow
  • Expect scenario questions comparing:
    • Git vs deployment pipelines
    • Collaboration vs governance
  • Remember:
    • JSON-based artifacts
    • Not all items are supported
    • No automatic commits

Practice Questions

Question 1 (Single choice)

What is the PRIMARY purpose of configuring version control for a Fabric workspace?

A. Improve query execution performance
B. Enable collaboration, change tracking, and rollback
C. Enforce row-level security
D. Automatically deploy content to production

Correct Answer: B

Explanation:
Version control enables source control integration, allowing teams to track changes, collaborate safely, and roll back when needed.


Question 2 (Multi-select)

Which version control systems can be integrated with Microsoft Fabric workspaces? (Select all that apply.)

A. Azure DevOps Git repositories
B. GitHub repositories
C. OneDrive for Business
D. SharePoint document libraries

Correct Answers: A, B

Explanation:
Fabric supports Git integration using Azure DevOps and GitHub. OneDrive and SharePoint are not supported for workspace version control.


Question 3 (Scenario-based)

A team wants to manage Power BI reports, semantic models, and dataflows using pull requests and branching. What should they configure?

A. Deployment pipelines
B. Sensitivity labels
C. Workspace version control with Git
D. Incremental refresh

Correct Answer: C

Explanation:
Git-based workspace version control enables branching, pull requests, and code reviews.


Question 4 (Single choice)

Which workspace role is REQUIRED to configure version control for a workspace?

A. Viewer
B. Contributor
C. Member
D. Admin

Correct Answer: D

Explanation:
Only workspace Admins can connect a workspace to a Git repository.


Question 5 (Scenario-based)

After connecting a workspace to a Git repository, where are Fabric items stored?

A. As binary files
B. As JSON-based artifact definitions
C. As SQL scripts
D. As Excel files

Correct Answer: B

Explanation:
Fabric artifacts are stored as JSON files, making them suitable for source control and comparison.


Question 6 (Multi-select)

Which items can be included in workspace version control? (Select all that apply.)

A. Reports
B. Semantic models
C. Dataflows Gen2
D. Dashboards

Correct Answers: A, B, C

Explanation:
Reports, semantic models, and dataflows are supported. Dashboards are typically excluded from version control scenarios.


Question 7 (Scenario-based)

A developer modifies a semantic model directly in the Fabric workspace while Git integration is enabled. What happens NEXT?

A. The change is automatically committed
B. The change is rejected
C. The workspace shows uncommitted changes
D. The change is immediately deployed to production

Correct Answer: C

Explanation:
Changes made in the workspace appear as pending/uncommitted changes until explicitly committed to the repository.


Question 8 (Single choice)

What is the relationship between workspace version control and deployment pipelines?

A. They are the same feature
B. Version control replaces deployment pipelines
C. They complement each other
D. Deployment pipelines require version control

Correct Answer: C

Explanation:
Version control handles source management, while deployment pipelines manage promotion across environments.


Question 9 (Scenario-based)

Your organization wants to prevent accidental overwrites when multiple developers edit the same item. Which feature BEST helps?

A. Row-level security
B. Sensitivity labels
C. Git branching and pull requests
D. Incremental refresh

Correct Answer: C

Explanation:
Git workflows enable controlled collaboration through branches, reviews, and merges.


Question 10 (Fill in the blank)

When version control is enabled, Fabric workspace changes must be ________ to the repository and ________ to update the workspace from Git.

Correct Answer:
Committed, synced (or pulled)

Explanation:
Changes flow both ways:

  • Commit workspace → Git
  • Sync Git → workspace

Create and configure deployment pipelines

This post is a part of the DP-600: Implementing Analytics Solutions Using Microsoft Fabric Exam Prep Hub; and this topic falls under these sections: 
Maintain a data analytics solution
--> Maintain the analytics development lifecycle
--> Create and configure deployment pipelines

Development pipelines in Microsoft Fabric provide a structured, governed way to promote analytics content across environments—typically Development, Test, and Production. They are a core lifecycle management feature that helps teams deploy changes safely, consistently, and with minimal risk. For the DP-600 exam, you should understand what development pipelines are, how they are configured, what they support, and how they differ from Git-based version control.

What Are Development Pipelines?

A development pipeline is a Fabric feature that:

  • Connects multiple workspaces into an ordered promotion flow
  • Enables controlled deployment of items between environments
  • Supports validation and testing before production release

Pipelines are especially important for enterprise-scale analytics solutions.

Typical Pipeline Structure

A standard Fabric pipeline consists of three stages:

  1. Development
    • Active development
    • Frequent changes
    • Used by engineers and analysts
  2. Test
    • Validation and user acceptance testing
    • Data and logic verification
    • Limited access
  3. Production
    • Certified, trusted content
    • Broad consumer access
    • Minimal direct changes

Each stage is linked to a separate Fabric workspace.

Creating a Development Pipeline

At a high level, the process is:

  1. Create a deployment pipeline in Microsoft Fabric
  2. Assign a workspace to each stage:
    • Dev workspace
    • Test workspace
    • Prod workspace
  3. Configure pipeline settings
  4. Control who can deploy between stages

Once created, the pipeline provides a visual interface showing item differences across stages.

What Items Can Be Deployed Through Pipelines?

Development pipelines support deployment of many Fabric items, including:

  • Semantic models
  • Reports and dashboards
  • Dataflows Gen2
  • Lakehouses and Warehouses (supported scenarios)
  • Other supported analytics artifacts

Exam note:
Not every Fabric item supports pipeline deployment equally—expect questions to focus on Power BI and core analytics items.

How Deployment Works

Comparing Changes

  • Pipelines show differences between stages
  • You can review what will change before deploying

Deploying Content

  • Deploy from Dev → Test
  • Validate
  • Deploy from Test → Prod

Deployments:

  • Copy item definitions
  • Can update existing items or create new ones
  • Do not automatically move workspace permissions

Deployment Rules and Parameters

Pipelines support deployment rules, such as:

  • Changing data source connections per environment
  • Switching parameters between Dev, Test, and Prod
  • Avoiding hard-coded environment values

This is critical for:

  • Separating development and production data
  • Supporting safe testing

Pipelines vs Git Integration (Exam Comparison)

This distinction is frequently tested.

FeatureDevelopment PipelinesGit Integration
PurposeEnvironment promotionSource control
FocusDeploymentVersioning
Tracks historyNoYes
Supports branchingNoYes
Typical useDev → Test → ProdCode collaboration

Key insight:
They are complementary, not competing features.

Permissions and Governance

To use pipelines:

  • Users need appropriate pipeline permissions
  • Workspace access is still required
  • Production deployments are often restricted to a small group

Pipelines support governance by:

  • Reducing direct changes in production
  • Enforcing controlled release processes
  • Improving auditability

Common Exam Scenarios

You may be asked to:

  • Choose pipelines for controlled promotion of reports
  • Identify when pipelines are preferable to manual publishing
  • Combine pipelines with Git and PBIP
  • Configure different data sources per environment
  • Prevent accidental production changes

Example:

A report must be tested before being released to executives.
Correct concept: Use a development pipeline with Dev, Test, and Prod stages.

Best Practices to Remember

  • Use separate workspaces per environment
  • Restrict production deployment permissions
  • Combine pipelines with:
    • PBIP projects
    • Git integration
    • Endorsements and certification
  • Avoid direct editing in production

Key Exam Takeaways

  • Development pipelines manage content promotion across environments
  • They connect multiple Fabric workspaces
  • Pipelines support comparison, validation, and controlled deployment
  • They do not replace Git-based version control
  • A core feature of the Fabric analytics lifecycle

Exam Tips

  • If a question focuses on moving content safely from development to production, the correct answer is development pipelines.
  • If it focuses on tracking changes or collaboration, the answer is Git or PBIP.
  • Know how pipelines support:
    • Dev/Test/Prod lifecycle
    • Governance & change control
    • Environment-specific configuration
    • Enterprise-scale BI practices
  • Common exam traps:
    • Confusing workspace roles with deploy permissions
    • Assuming pipelines manage security or performance
    • Forgetting deployment rules

Practice Questions

Question 1 (Single choice)

What is the PRIMARY purpose of a deployment pipeline in Microsoft Fabric?

A. Schedule dataset refreshes
B. Promote content across lifecycle environments
C. Enable row-level security
D. Optimize DAX performance

Correct Answer: B

Explanation:
Deployment pipelines are designed to promote content across environments (for example, Development → Test → Production) in a controlled and governed manner.

  • ❌ A: Refresh scheduling is handled separately
  • ❌ C: Security is not the primary purpose
  • ❌ D: Performance tuning is unrelated

Question 2 (Multi-select)

Which stages are available by default in a Fabric deployment pipeline? (Select all that apply.)

A. Development
B. Test
C. Production
D. Sandbox

Correct Answers: A, B, C

Explanation:
Fabric deployment pipelines use a three-stage lifecycle:

  • Development
  • Test
  • Production

There is no default Sandbox stage.


Question 3 (Scenario-based)

A team wants analysts to freely modify reports, while only approved changes reach production. Which pipeline stage should analysts primarily work in?

A. Production
B. Test
C. Development
D. Any stage

Correct Answer: C

Explanation:
The Development stage is intended for:

  • Frequent changes
  • Experimentation
  • Initial validation

Higher stages are more controlled.


Question 4 (Single choice)

Which permission is required to deploy content from one stage to the next in a deployment pipeline?

A. Viewer
B. Contributor
C. Admin
D. Pipeline deploy permission

Correct Answer: D

Explanation:
Deploying content requires explicit pipeline deployment permissions, not just workspace roles.

  • ❌ Admin alone is not sufficient
  • ❌ Contributor may edit but not deploy

Question 5 (Scenario-based)

You deploy a semantic model from Test to Production. What happens to data source connections by default?

A. They are deleted
B. They remain unchanged
C. They can be overridden per stage
D. They must be manually reconfigured

Correct Answer: C

Explanation:
Deployment pipelines support parameter and data source rules, allowing environment-specific connections.


Question 6 (Multi-select)

Which items can be deployed using deployment pipelines? (Select all that apply.)

A. Reports
B. Semantic models
C. Dashboards
D. Notebooks

Correct Answers: A, B, C

Explanation:
Deployment pipelines support Power BI artifacts, including:

  • Reports
  • Semantic models
  • Dashboards

❌ Notebooks are Fabric artifacts but are not deployed via Power BI deployment pipelines.


Question 7 (Scenario-based)

A deployment shows warnings that some items are skipped. What is the MOST likely cause?

A. The workspace is full
B. Unsupported artifacts exist
C. The dataset is too large
D. Git integration is disabled

Correct Answer: B

Explanation:
Unsupported or incompatible artifacts (for example, unsupported report types) may be skipped during deployment.


Question 8 (Single choice)

Which feature allows different environments to use different data sources during deployment?

A. Row-level security
B. Dynamic format strings
C. Deployment rules
D. Incremental refresh

Correct Answer: C

Explanation:
Deployment rules allow:

  • Data source switching
  • Parameter overrides
  • Environment-specific configuration

Question 9 (Scenario-based)

You want production users to access only certified content. How do deployment pipelines help?

A. By enforcing sensitivity labels
B. By promoting tested content only
C. By encrypting production reports
D. By disabling edit access

Correct Answer: B

Explanation:
Deployment pipelines ensure:

  • Content is validated in Test
  • Only approved changes reach Production

They support trust and governance, not encryption or labeling.


Question 10 (Multi-select)

Which best practices apply when configuring deployment pipelines? (Select all that apply.)

A. Restrict deploy permissions
B. Use separate data sources per stage
C. Allow all users to deploy to Production
D. Validate content in Test before Production

Correct Answers: A, B, D

Explanation:
Best practices include:

  • Limited deploy access
  • Environment-specific configurations
  • Mandatory testing before production

❌ Allowing everyone to deploy defeats governance.


Perform impact analysis of downstream dependencies from lakehouses, data warehouses, dataflows, and semantic models in Microsoft Fabric

This post is a part of the DP-600: Implementing Analytics Solutions Using Microsoft Fabric Exam Prep Hub; and this topic falls under these sections: 
Maintain a data analytics solution
--> Maintain the analytics development lifecycle
--> Perform impact analysis of downstream dependencies from lakehouses,
data warehouses, dataflows, and semantic models

Impact analysis in Microsoft Fabric helps analytics engineers understand how changes to upstream data assets affect downstream items such as datasets, reports, dashboards, notebooks, and pipelines. It is a critical lifecycle practice that reduces the risk of breaking analytics solutions when making schema, logic, or data changes.

For the DP-600 exam, you should understand what impact analysis is, which Fabric tools support it, what dependencies are tracked, and how to use it in real-world lifecycle scenarios.

What Is Impact Analysis?

Impact analysis answers the question:

“If I change or delete this item, what else will be affected?”

It allows you to:

  • Identify downstream dependencies
  • Assess risk before making changes
  • Communicate potential impacts to stakeholders
  • Support safe development and deployment practices

Impact analysis is observational and informational—it does not enforce controls.

Where Impact Analysis Is Used in Fabric

Impact analysis applies across many Fabric items, including:

  • Lakehouses
  • Data Warehouses
  • Dataflows Gen2
  • Semantic models
  • Reports and dashboards
  • Notebooks and pipelines

These items form a connected analytics graph, which Fabric can visualize.

Lineage View: The Core Tool for Impact Analysis

The primary tool for impact analysis in Fabric is Lineage View.

What Lineage View Shows

  • Upstream data sources
  • Transformations and processing steps
  • Downstream consumers
  • Relationships between items

Lineage view provides a visual map of dependencies across workloads.

Impact Analysis by Asset Type

Lakehouses

Changing a Lakehouse can impact:

  • Notebooks reading tables
  • Semantic models using Direct Lake
  • Dataflows writing or reading data
  • Reports built on dependent models

Common risk: Dropping or renaming a column.

Data Warehouses

Warehouse changes may affect:

  • Views and SQL queries
  • Semantic models using DirectQuery
  • Reports and dashboards
  • External tools

Exam insight: Schema changes are a common source of downstream failures.

Dataflows Gen2

Dataflows often sit between raw data and analytics.

Changes can impact:

  • Lakehouses or Warehouses they load into
  • Semantic models consuming curated tables
  • Pipelines orchestrating refreshes

Semantic Models

Semantic models are among the most sensitive assets.

Changes may affect:

  • Reports and dashboards
  • Excel workbooks
  • Composite models
  • End-user self-service analytics

Exam note: Removing measures or renaming fields is high risk.

How to Perform Impact Analysis (High Level)

  1. Select the item (Lakehouse, Warehouse, Dataflow, or Semantic Model)
  2. Open Lineage view
  3. Review downstream dependencies
  4. Identify:
    • Reports
    • Datasets
    • Pipelines
    • Other dependent items
  5. Communicate or mitigate risk before making changes

Impact Analysis in the Development Lifecycle

Impact analysis is typically performed:

  • Before deploying changes
  • Before modifying schemas
  • Before deleting items
  • During troubleshooting

It supports:

  • Safe Git commits
  • Controlled pipeline deployments
  • Production stability

Common Exam Scenarios

You may see questions such as:

  • A column change breaks multiple reports → impact analysis was skipped
  • An engineer needs to know which reports use a dataset → lineage view
  • A Lakehouse schema update affects downstream models → review dependencies
  • A dataset should not be modified due to executive reports → high downstream impact

Example:

Before removing a table from a semantic model, what should you do?
Correct concept: Perform impact analysis using lineage view.

Impact Analysis vs Deployment Pipelines

These concepts are related but distinct.

FeatureImpact AnalysisDeployment Pipelines
PurposeRisk assessmentControlled promotion
EnforcedNoYes
TimingBefore changesDuring deployment
ToolLineage viewPipeline UI

Best Practices to Remember

  • Always check lineage before schema changes
  • Pay extra attention to semantic models and certified items
  • Communicate impacts to report owners
  • Pair impact analysis with:
    • Version control
    • Development pipelines
    • Endorsements and certification

Key Exam Takeaways

  • Impact analysis identifies downstream dependencies
  • Lineage view is the primary tool in Fabric
  • Applies to Lakehouses, Warehouses, Dataflows, and Semantic Models
  • Supports safe lifecycle and governance practices
  • A common scenario-based exam topic

Final Exam Tip

  • If a question asks what will break if I change this, the answer is impact analysis via lineage view.
  • If it asks how to safely move changes, the answer is pipelines or Git.
  • Expect questions that test:
    • When to perform impact analysis
    • Which items are affected by changes
    • Operational decision-making before deployments
  • Common traps:
    • Confusing impact analysis with lineage documentation
    • Assuming Fabric blocks breaking changes automatically
    • Forgetting semantic models are often the most impacted layer

Practice Questions

Question 1 (Single choice)

What is the PRIMARY purpose of impact analysis in Microsoft Fabric?

A. Improve query performance
B. Identify downstream objects affected by a change
C. Enforce data security policies
D. Reduce data refresh frequency

Correct Answer: B

Explanation:
Impact analysis helps you understand what items depend on a given artifact, so you can assess the risk of changes.

  • ❌ A: Performance tuning is separate
  • ❌ C: Security is not the focus
  • ❌ D: Refresh tuning is unrelated

Question 2 (Multi-select)

Which Fabric items can be analyzed for downstream dependencies? (Select all that apply.)

A. Lakehouses
B. Data warehouses
C. Dataflows
D. Semantic models

Correct Answers: A, B, C, D

Explanation:
Microsoft Fabric supports dependency tracking across all major analytical artifacts, enabling end-to-end lineage visibility.


Question 3 (Scenario-based)

You plan to rename a column in a lakehouse table. Which Fabric feature should you use FIRST?

A. Version control
B. Deployment pipeline
C. Impact analysis
D. Incremental refresh

Correct Answer: C

Explanation:
Renaming a column may break:

  • Semantic models
  • SQL queries
  • Reports

Impact analysis identifies what will be affected before the change.


Question 4 (Single choice)

Where do you access impact analysis for an item in Fabric?

A. Power BI Desktop
B. Microsoft Purview portal
C. Item settings in the Fabric workspace
D. Azure DevOps

Correct Answer: C

Explanation:
Impact analysis is accessible directly from the item context or settings within a Fabric workspace.

  • ❌ Purview focuses on governance/catalog
  • ❌ DevOps is not used for lineage

Question 5 (Scenario-based)

A dataflow loads data into a lakehouse that feeds multiple semantic models. What does impact analysis show?

A. Only the lakehouse
B. Only the semantic models
C. All downstream dependencies
D. Only refresh schedules

Correct Answer: C

Explanation:
Impact analysis provides a full dependency graph, showing all downstream items affected by changes.


Question 6 (Multi-select)

Which changes typically REQUIRE impact analysis before execution? (Select all that apply.)

A. Dropping columns
B. Renaming tables
C. Changing data types
D. Adding a new report page

Correct Answers: A, B, C

Explanation:
Structural changes can break dependencies. Adding a report page does not affect downstream items.


Question 7 (Scenario-based)

A semantic model is used by several reports and dashboards. What happens if you delete the model without impact analysis?

A. Nothing; reports are cached
B. Reports automatically reconnect
C. Reports and dashboards break
D. Fabric blocks the deletion

Correct Answer: C

Explanation:
Deleting a semantic model removes the data source for:

  • Reports
  • Dashboards

Impact analysis helps prevent such disruptions.


Question 8 (Single choice)

Which view best represents impact analysis results?

A. Tabular grid
B. SQL execution plan
C. Dependency graph
D. DAX query view

Correct Answer: C

Explanation:
Impact analysis is presented as a visual dependency graph, showing upstream and downstream relationships.


Question 9 (Scenario-based)

Which role MOST benefits from performing impact analysis regularly?

A. Report consumers
B. Workspace admins and data engineers
C. End-user analysts
D. External auditors

Correct Answer: B

Explanation:
Admins and engineers are responsible for:

  • Schema changes
  • Deployments
  • Stability

Impact analysis supports safe operational changes.


Question 10 (Multi-select)

Which best practices apply when using impact analysis? (Select all that apply.)

A. Perform before structural changes
B. Use in conjunction with deployment pipelines
C. Skip for minor schema updates
D. Communicate findings to stakeholders

Correct Answers: A, B, D

Explanation:
Impact analysis should:

  • Precede schema changes
  • Inform deployment decisions
  • Be communicated to stakeholders

❌ “Minor” changes can still break dependencies.


Create and Update Reusable Assets, including Power BI template (.pbit) files, Power BI data source (.pbids) files, and shared semantic models in Microsoft Fabric

This post is a part of the DP-600: Implementing Analytics Solutions Using Microsoft Fabric Exam Prep Hub; and this topic falls under these sections: 
Maintain a data analytics solution
--> Maintain the analytics development lifecycle
--> Create and update reusable assets, including Power BI template (.pbit)
files, Power BI data source (.pbids) files, and shared semantic models

Reusable assets are a key lifecycle concept in Microsoft Fabric and Power BI. They enable consistency, scalability, and efficiency by allowing teams to standardize how data is connected, modeled, and visualized across multiple solutions.

For the DP-600 exam, you should understand what reusable assets are, how to create and manage them, and when each type is appropriate.

What Are Reusable Assets?

Reusable assets are analytics artifacts designed to be:

  • Used by multiple users or teams
  • Reapplied across projects
  • Centrally governed and maintained

Common reusable assets include:

  • Power BI template (.pbit) files
  • Power BI data source (.pbids) files
  • Shared semantic models

Power BI Template Files (.pbit)

What Is a PBIT File?

A .pbit file is a Power BI template that contains:

  • Report layout and visuals
  • Data model structure (tables, relationships, measures)
  • Parameters and queries (without data)

It does not include actual data.

When to Use PBIT Files

PBIT files are ideal when:

  • Standardizing report design and metrics
  • Distributing reusable report frameworks
  • Supporting self-service analytics at scale
  • Onboarding new analysts

Creating and Updating PBIT Files

  • Create a report in Power BI Desktop
  • Remove data (if present)
  • Save as Power BI Template (.pbit)
  • Store in source control or shared repository
  • Update centrally and redistribute as needed

Power BI Data Source Files (.pbids)

What Is a PBIDS File?

A .pbids file is a JSON-based file that defines:

  • Data source connection details
  • Server, database, or endpoint information
  • Authentication type (but not credentials)

Opening a PBIDS file launches Power BI Desktop and guides users through connecting to the correct data source.

When to Use PBIDS Files

PBIDS files are useful for:

  • Standardizing data connections
  • Reducing configuration errors
  • Guiding business users to approved sources
  • Supporting governed self-service analytics

Managing PBIDS Files

  • Create manually or export from Power BI Desktop
  • Store centrally (e.g., Git, SharePoint)
  • Update when connection details change
  • Pair with shared semantic models where possible

Shared Semantic Models

What Are Shared Semantic Models?

Shared semantic models are centrally managed datasets that:

  • Define business logic, measures, and relationships
  • Serve as a single source of truth
  • Are reused across multiple reports

They are one of the most important reusable assets in Fabric.

Benefits of Shared Semantic Models

  • Consistent metrics across reports
  • Reduced duplication
  • Centralized governance
  • Better performance and manageability

Managing Shared Semantic Models

Shared semantic models are:

  • Developed by analytics engineers
  • Published to Fabric workspaces
  • Shared using Build permission
  • Governed with:
    • RLS and OLS
    • Sensitivity labels
    • Endorsements (Promoted/Certified)

How These Assets Work Together

A common pattern:

  • PBIDS → Standardizes connection
  • Shared semantic model → Defines logic
  • PBIT → Standardizes report layout

This layered approach is frequently tested in exam scenarios.

Reusable Assets and the Development Lifecycle

Reusable assets support:

  • Faster development
  • Consistent deployments
  • Easier maintenance
  • Scalable self-service analytics

They align naturally with:

  • PBIP projects
  • Git version control
  • Development pipelines
  • XMLA-based automation

Common Exam Scenarios

You may be asked:

  • How to distribute a standardized report template → PBIT
  • How to ensure users connect to the correct data source → PBIDS
  • How to enforce consistent business logic → Shared semantic model
  • How to reduce duplicate datasets → Shared model + Build permission

Example:

Multiple teams need to create reports using the same metrics and layout.
Correct concepts: Shared semantic model and PBIT.

Best Practices to Remember

  • Centralize ownership of shared semantic models
  • Certify trusted reusable assets
  • Store templates and PBIDS files in source control
  • Avoid duplicating business logic in individual reports
  • Pair reusable assets with governance features

Key Exam Takeaways

  • Reusable assets improve consistency and scalability
  • PBIT files standardize report design
  • PBIDS files standardize data connections
  • Shared semantic models centralize business logic
  • All are core lifecycle tools in Fabric

Exam Tips

  • If a question focuses on standardization, reuse, or self-service at scale, think PBIT, PBIDS, and shared semantic models—and choose the one that matches the problem being solved.
  • Expect scenarios that test:
    • When to use PBIT vs PBIDS vs shared semantic models
    • Governance and consistency
    • Enterprise BI scalability
  • Quick memory aid:
    • PBIT = Layout + Model (no data)
    • PBIDS = Connection only
    • Shared model = Logic once, reports many

Practice Questions

Question 1 (Single choice)

What is the PRIMARY purpose of a Power BI template (.pbit) file?

A. Store report data for reuse
B. Share report layout and model structure without data
C. Store credentials securely
D. Enable real-time data refresh

Correct Answer: B

Explanation:
A .pbit file contains:

  • Report layout
  • Semantic model (tables, relationships, measures)
  • No data

It’s used to standardize report creation.


Question 2 (Multi-select)

Which components are included in a Power BI template (.pbit)? (Select all that apply.)

A. Report visuals
B. Data model schema
C. Data source credentials
D. DAX measures

Correct Answers: A, B, D

Explanation:

  • Templates include visuals, schema, relationships, and measures.
  • ❌ Credentials and data are never included.

Question 3 (Scenario-based)

Your organization wants users to quickly connect to approved data sources while preventing incorrect connection strings. Which reusable asset is BEST?

A. PBIX file
B. PBIT file
C. PBIDS file
D. Shared semantic model

Correct Answer: C

Explanation:
PBIDS files:

  • Predefine connection details
  • Guide users to approved data sources
  • Improve governance and consistency

Question 4 (Single choice)

Which statement about Power BI data source (.pbids) files is TRUE?

A. They contain report visuals
B. They contain DAX measures
C. They define connection metadata only
D. They store dataset refresh schedules

Correct Answer: C

Explanation:
PBIDS files only store:

  • Data source type
  • Server/database info
    They do NOT include visuals, data, or logic.

Question 5 (Scenario-based)

You want multiple reports to use the same curated dataset to ensure consistent KPIs. What should you implement?

A. Multiple PBIX files
B. Power BI templates
C. Shared semantic model
D. PBIDS files

Correct Answer: C

Explanation:
A shared semantic model allows:

  • Centralized logic
  • Single source of truth
  • Multiple reports connected via Live/Direct Lake

Question 6 (Multi-select)

Which benefits are provided by shared semantic models? (Select all that apply.)

A. Consistent calculations across reports
B. Reduced duplication of datasets
C. Independent refresh schedules per report
D. Centralized security management

Correct Answers: A, B, D

Explanation:

  • Shared models enforce consistency and reduce maintenance.
  • ❌ Refresh is managed at the model level, not per report.

Question 7 (Scenario-based)

You update a shared semantic model’s calculation logic. What is the impact?

A. Only new reports see the change
B. All connected reports reflect the change
C. Reports must be republished
D. Only the workspace owner sees updates

Correct Answer: B

Explanation:
All reports connected to a shared semantic model automatically reflect changes.


Question 8 (Single choice)

Which reusable asset BEST supports report creation without requiring Power BI Desktop modeling skills?

A. PBIX file
B. PBIT file
C. PBIDS file
D. Shared semantic model

Correct Answer: D

Explanation:
Users can build reports directly on shared semantic models using existing fields and measures.


Question 9 (Scenario-based)

You want to standardize report branding, page layout, and slicers across teams. What should you distribute?

A. PBIDS file
B. Shared semantic model
C. PBIT file
D. XMLA script

Correct Answer: C

Explanation:
PBIT files are ideal for:

  • Visual consistency
  • Reusable layouts
  • Standard filters and slicers

Question 10 (Multi-select)

Which are BEST practices when managing reusable Power BI assets? (Select all that apply.)

A. Store PBIT and PBIDS files in version control
B. Update shared semantic models directly in production without testing
C. Document reusable asset usage
D. Combine shared semantic models with deployment pipelines

Correct Answers: A, C, D

Explanation:
Best practices emphasize:

  • Governance
  • Controlled updates
  • Documentation

❌ Direct production edits increase risk.


Merging Two Excel Files or Sheets Using Power Query (with the merge based on Multiple Columns)

Excel Power Query is a powerful, no-code/low-code tool that allows you to combine and transform data from multiple sources in a repeatable and refreshable way. One common use case is merging two Excel files or worksheets based on multiple matching columns, similar to a SQL join. Power Query is a major part of Power BI, but it can be used in Excel.

When to Use Power Query for Merging

Power Query is ideal when:

  • You receive recurring Excel files with the same structure
  • You need a reliable, refreshable merge process
  • You want to avoid complex formulas like VLOOKUP or XLOOKUP across many columns

Step-by-Step Overview

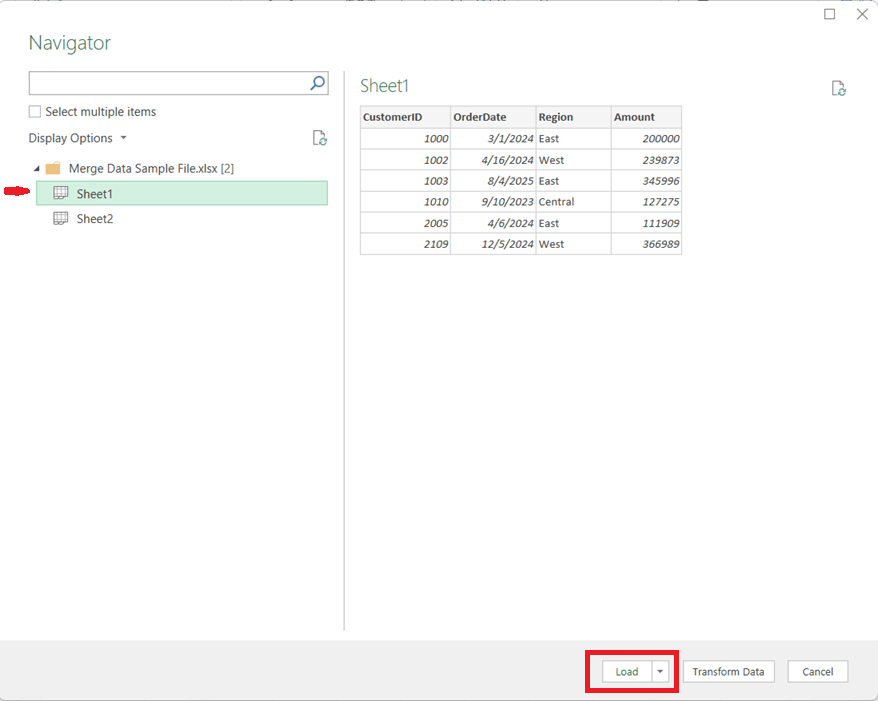
1. Load Both Data Sources into Power Query

  • Open Excel and go to Data → Get Data
  • Choose From Workbook (for separate files) or From Table/Range (for sheets in the same file)

Tip: Ensure the columns you plan to merge on have the same data types (e.g., text vs. number).


  • Load each dataset into Power Query as a separate query

2. Start the Merge Operation

  • In Power Query, select the primary table
  • Go to Query → Merge Queries
  • Choose the secondary table from the dropdown

3. Select Multiple Matching Columns

  • Click the first matching column in the primary table
  • Hold Ctrl (or Cmd on Mac) and select additional matching columns
  • Repeat the same column selections in the secondary table, in the same order

For example, if you needed to perform the merge on CustomerID, OrderDate, and Region, you would click Customer ID, then hold the Ctrl key and click OrderDate, then (while still holding down the Ctrl key) click Region.

Power Query treats this as a composite key, and all selected columns must match for rows from both tables to merge.


4. Choose the Join Type

Select the appropriate join kind:

  • Left Outer – Keep all rows from the first table (most common) and brings in the values for the matching rows from the second table
  • Inner – Keep only matching rows from both tables
  • Full Outer – Keep all rows from both tables, merging the table where there is a match and having just the values from the respective tables when there is no match

Click OK to complete the merge.


5. Expand the Merged Data

  • A new column appears containing nested tables
  • Click the expand icon to select which columns to bring in
  • Remove unnecessary columns to keep the dataset clean

6. Load and Refresh

  • Click Close & Load
  • The merged dataset is now available in Excel
  • When source files change, simply click Refresh to update everything automatically

Key Benefits

  • Handles multi-column joins cleanly and reliably
  • Eliminates fragile lookup formulas
  • Fully refreshable and auditable
  • Scales well as data volume grows

In Summary

Using Power Query to merge Excel data on multiple columns brings database-style joins into Excel, making your workflows more robust, maintainable, and professional. Once set up, it saves time and reduces errors—especially for recurring reporting and analytics tasks.

Thanks for reading!

Creating a DATE value in Power BI DAX, Power Query M, and Excel

You may at times need to create a date value in Power BI either using DAX or M, or in Excel. This is a quick post that describes how to create a date value in Power BI DAX, Power Query M language, and in Excel. Working with dates is an every-day thing for anyone that works with data.

In Power BI DAX, the syntax is:

DATE(<year>, <month>, <day>) //the parameters must be valid numbers

DATE(2025, 8, 23) //returns August 23, 2025

In Power Query M, the syntax is:

#date(<year>, <month>, <day>) //the parameters must be valid numbers

#date(2022, 3, 6) //returns March 6, 2022

In Excel, the syntax is:

DATE(<year>, <month>, <day>) //the parameters must be valid numbers

DATE(1989, 12, 3) //produces 12/3/1989 (officially returns a number that represents the date in Excel date-time code)

Thanks for reading. Hope you found this useful.

Using MAXX in Power BI to find the Latest Event Date across several event date columns in each row

We were working with some HR data which included multiple date fields such as Hire Date, Transfer Date, Promotion Date, and Termination Date. We needed to determine the most recent event date before termination. We ended up using the MAXX function to do this.

Sample dataset to demonstrate the scenario:

Using the following dataset to demonstrate the example:

EmployeeHire DateTransfer DatePromotion DateTermination Date
Alice2020-01-152021-05-102022-03-202023-06-15
Bob2019-11-012020-07-152021-10-05(blank)
Carol2021-03-25(blank)2021-09-142022-02-28

The goal is to calculate the most recent event and event date (i.e., the latest event and its date) between Hire Date, Transfer Date, and Promotion Date for each row. Termination Date was excluded from the comparison because the goal was to find the latest event before Termination (if that had occurred).

Using MAXX for Row-by-Row Evaluation

MAXX is an iterator function in DAX, meaning it evaluates an expression for each row of a table, then returns the maximum value. Iterator functions such as MAXX and SUMX work row-by-row over a table, in contrast to aggregate functions like MAX and SUM which operate over an entire column at once.

  • Aggregate example (MAX): Finds the highest value in a column across all rows.
  • Iterator example (MAXX): Evaluates an expression for each row in a virtual table, then finds the highest value.

This makes MAXX ideal for scenarios like this where the various dates are in multiple columns of the same row, and we need to find the max of these dates on each row.

DAX Code Example: This is an example of the code that was used to derive the latest event date.

Latest Event Date =
MAXX(
{
[Hire Date],
[Transfer Date],
[Promotion Date]
},
[Value]
)

Code Explanation:

  1. Create a virtual table with one column and three rows—one for each date we want to consider.
  2. MAXX iterates through this virtual table, evaluates [Value] (the date), and returns the latest / maximum (max) date for each iteration.

Expected Output based on the sample dataset:

EmployeeHire DateTransfer DatePromotion DateTermination DateLatest Event Date
Alice2020-01-152021-05-102022-03-202023-06-152022-03-20
Bob2019-11-012020-07-152021-10-05(blank)2021-10-05
Carol2021-03-25(blank)2021-09-142022-02-282021-09-14

This is much cleaner than using nested IF checks to determine the latest date / latest event for each record. Of course, the MAXX function can be used in other scenarios where you want to find the max value across multiple columns on each row.

Thanks for reading and I hope you found this useful!

Mastering the SWITCH Function in Power BI DAX – includes usage and code examples

When building measures and calculated columns in Power BI, we often face situations where we need to evaluate multiple possible outcomes and return different results based on conditions. While IF statements can handle this, they can become cumbersome, confusing, and hard to read when there are many branches.

The SWITCH function in DAX is a cleaner, more efficient alternative for handling multiple condition checks. Let’s take a look.

SWITCH Function Signature

The basic DAX syntax of the SWITCH function is:

SWITCH(<expression>,
       <value1>, <result1>,
       <value2>, <result2>,
       ...,
       [<else>])
  • <expression> – The value or expression you want to evaluate once.
  • <valueN> – A possible value that the expression could equal.
  • <resultN> – The result to return if the expression equals the corresponding <valueN>.
  • [<else>] – (Optional) The default result if none of the value-result pairs match.

Note: the <expression> is evaluated once and compared against multiple <value> options in sequence until a match is found.

Example 1 – Basic SWITCH Usage

Suppose we have a Customer[Category] column containing numeric codes:

  • 1 = “Bronze”
  • 2 = “Silver”
  • 3 = “Gold”

We can translate these codes into readable labels using SWITCH as in the following DAX code example:

Customer Category Label =
SWITCH(Customer[Category],
       1, "Bronze",
       2, "Silver",
       3, "Gold",
       "Unknown"
      )

Explanation:
– The Customer[Category] column is evaluated once.
– If it equals 1, "Bronze" is returned; if 2, "Silver"; if 3, "Gold".
– Otherwise, "Unknown" is returned.

Example 2 – Multiple Match Checks

If we wanted to calculate a commission rate based on a sales tier:

Commission Rate =
SWITCH(Sales[SalesTier],
       "Low", 0.02,
       "Medium", 0.05,
       "High", 0.08,
       0
)

Explanation:
– The Sales[SalesTier] column is evaluated once.
– If it equals "Low", 0.02 is returned; if "Medium", 0.05; if "High", 0.08.
– Otherwise, 0 is returned.

The SWITCH TRUE Pattern

This is a really cool and handy usage of the function. Sometimes, we don’t have a single value to compare against. Instead, we want to evaluate different logical conditions. In these cases, we can use the SWITCH TRUE pattern, which works like multiple IF statements but is much cleaner.

DAX Syntax:

SWITCH( TRUE(),
<condition1>, <result1>,
<condition2>, <result2>,
...,
[<else>])

Here, TRUE() acts as the <expression>. Each <condition> is a Boolean expression that returns TRUE or FALSE. The function returns the corresponding result of the first condition that evaluates to TRUE.

Example 3 – SWITCH TRUE for Ranges

Suppose we want to grade students based on their score:

Grade =
SWITCH(TRUE(),
Scores[Score] >= 90, "A",
Scores[Score] >= 80, "B",
Scores[Score] >= 70, "C",
Scores[Score] >= 60, "D",
"F"
)

Explanation:
– Each Scores[Score] comparison statement is evaluated in order from top to bottom, and returns the first match.
– If Scores[Score] >= 90, “A” is returned; if Scores[Score] >= 80, “B”; if Scores[Score] >= 70, “C”, if Scores[Score] >= 60, “D”
– Otherwise, “F” is returned.

Note: Other more complex conditions, such as ones using OR and AND logic or including complex calculations, can be used.

Why SWITCH is such a great, clean, easy to use function:

  • No nested IFs.
  • Each condition is independent.
  • Easy to add or modify conditions.

When to Use SWITCH Instead of IF

While IF can achieve the same results, SWITCH has several advantages:

  1. ReadabilitySWITCH structures conditions in a clear, top-to-bottom list.
  2. Maintainability – Easier to add, remove, or change cases without dealing with messy nested parentheses.
  3. Performance – In some cases, SWITCH can be more efficient because the expression (in the basic form) is evaluated once, not multiple times as with nested IF statements.
  4. Logical Branching – The SWITCH TRUE pattern handles complex conditions without deep nesting.

Example 4 – IF vs. SWITCH

Let’s take a look at a comparison example:

IF Version:
Category Label =
IF(Customer[Category] = 1, "Bronze",
IF(Customer[Category] = 2, "Silver",
IF(Customer[Category] = 3, "Gold", "Unknown")
)
)

SWITCH Version:
Category Label =
SWITCH(Customer[Category],
1, "Bronze",
2, "Silver",
3, "Gold",
"Unknown"
)

Result: As you can see, the SWITCH version is shorter, easier to read, less error-prone, and easier to maintain.

Key Takeaways

  • Use basic SWITCH when comparing one expression to multiple possible values.
  • Use SWITCH TRUE when checking multiple conditions or ranges.
  • SWITCH often results in cleaner, more maintainable DAX than deeply nested IF statements.
  • Always include a default (else) value to handle unexpected cases.

Thanks for reading and I hope you found this useful.

Calculated Columns vs. Measures in Power BI: Understanding the Differences

When working in Power BI, two common ways to add custom calculations to your data model are calculated columns and measures. While they both use DAX (Data Analysis Expressions), their purposes, storage, and performance implications differ significantly. Understanding these differences can help you design more efficient and maintainable Power BI reports.

1. What They Are

Calculated Column
A calculated column is a new column added to a table in your data model. It is calculated row-by-row based on the existing data and stored in the model like any other column.

Measure
A measure is a calculation that is evaluated on the fly, usually aggregated at the visual level. Measures don’t exist as stored data in your table—they are computed dynamically based on filter context.

To create a Calculated Column or a Measure, either from the Home menu …

… or from the Table Tools menu …

… select “New Column” (to create a Calculated Column) or “New Measure” (to create a new measure). Then enter the relevant DAX for the column or measure as shown in the next section below.

2. DAX Syntax Examples

Imagine a Sales table with columns: Product, Quantity, and Unit Price.

Calculated Column Example
Creating a calculated column:
Total Price = Sales[Quantity] * Sales[Unit Price]

This new column will appear in the table and will be stored for every row in the Sales table.

Measure Example
Creating a measure:
Total Sales = SUMX(Sales, Sales[Quantity] * Sales[Unit Price])

This measure calculates the total across all rows in the current filter context—without physically storing a column for every row.

3. When They Are Computed

FeatureCalculated ColumnMeasure
When computedDuring data model processing (data refresh).At query time (when a visual or query is run).
Where storedIn-memory within the data model (VertiPaq storage).Not stored—calculated on demand.
Performance impactIncreases model size (RAM & disk space).Consumes CPU at query time, minimal storage overhead.

4. Storage and Performance Implications

  • Calculated Columns
    • RAM & Disk Space: Stored in VertiPaq compression format. Large columns increase your .pbix file size and memory footprint.
    • CPU: Low impact at query time since results are precomputed, but refresh time increases.
    • Good for: Fields you need for filtering, sorting, or joining tables.
  • Measures
    • RAM & Disk Space: No significant impact on storage since they’re not persisted.
    • CPU: Can be CPU-intensive if the calculation is complex and used across large datasets.
    • Good for: Aggregations, KPIs, and calculations that change based on slicers or filters.

5. When to Use Each

When to Use a Calculated Column

  • You need a field for row-level filtering or grouping in visuals.
  • You need a column to create relationships between tables.
  • The calculation is row-specific and independent of report filters.

Example:

Sales Category = IF(Sales[Quantity] > 100, "High Volume", "Low Volume")

When to Use a Measure

  • You want calculations that respond dynamically to slicers and filters.
  • You want to avoid inflating your data model with unnecessary stored columns.
  • The calculation is aggregate-based.

Example:

Average Order Value = DIVIDE([Total Sales], DISTINCTCOUNT(Sales[Order ID]))

6. When They Cannot Be Used

SituationCalculated ColumnMeasure
Relationship creation✅ Can be used❌ Cannot be used
Row-level filtering in slicers✅ Can be used❌ Cannot be used
Dynamic response to slicers❌ Cannot recalculate✅ Fully dynamic
Reduce model size❌ Adds storage✅ No storage impact

7. Summary Table

FeatureCalculated ColumnMeasure
Stored in modelYesNo
Calculated atData refreshQuery time
Memory impactHigher (stored per row)Minimal
Disk size impactHigherMinimal
Dynamic filtersNoYes
Best forFiltering, relationships, sortingAggregations, KPIs, dynamic calcs

8. Best Practices

  • Default to measures when possible—they’re lighter and more flexible.
  • Use calculated columns sparingly, only when the calculation must exist at the row level in the data model.
  • If a calculated column is only used in visuals, try converting it to a measure to save memory.
  • Be mindful of CPU impact for very complex measures—optimize DAX to avoid performance bottlenecks.

I hope this was helpful in clarifying the differences between Calculated Columns and Measures, and will help you to determine which you need in various scenarios for your Power BI solutions.

Thanks for reading!