Category: Data Development

Understanding UNION, INTERSECT, and EXCEPT in Power BI DAX

When working with data in Power BI, it’s common to need to combine, compare, or filter tables based on their rows. DAX provides three powerful table / set functions for this: UNION, INTERSECT, and EXCEPT.

These functions are especially useful in advanced calculations, comparative analysis, and custom table creation in reports. If you have used these functions in SQL, the concepts here will be familiar.

Sample Dataset

We’ll use the following two tables throughout our examples:

Table: Sales_2024

The above table (Sales_2024) was created using the following DAX code utilizing the DATATABLE function (or you could enter the data directly using the Enter Data feature in Power BI):

Table: Sales_2025
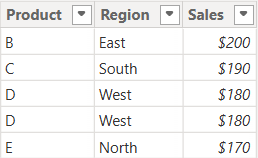
The above table (Sales_2025) was created using the following DAX code utilizing the DATATABLE function (or you could enter the data directly using the Enter Data feature in Power BI):
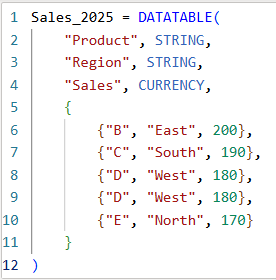
Now that we have our two test tables, we can now use them to explore the 3 table / set functions – Union, Intersect, and Except.

1. UNION – Combine Rows from Multiple Tables

The UNION function returns all rows from both tables, including duplicates. It requires the same number of columns and compatible data types in corresponding columns in the the tables being UNION’ed. The column names do not have to match, but the number of columns and datatypes need to match.

DAX Syntax:

UNION(<Table1>, <Table2>)

For our example, here is the syntax and resulting dataset:

UnionTable = UNION(Sales_2024, Sales_2025)

As you can see, the UNION returns all rows from both tables, including duplicates.

If you were to reverse the order of the tables (in the function call), the result remains the same (as shown below):

To remove duplicates, you can wrap the UNION inside a DISTINCT() function call, as shown below:

2. INTERSECT – Returns Rows Present in Both Tables

The INTERSECT function returns only the rows that appear in both tables (based on exact matches across all columns).

DAX Syntax:

INTERSECT(<Table1>, <Table2>)

For our example, here is the syntax and resulting dataset:

IntersectTable = INTERSECT(Sales_2024, Sales_2025)

Only the rows in Sales_2024 that are also found in Sales_2025 are returned.

If you were to reverse the order of the tables, you would get the following result:

IntersectTableReverse = INTERSECT(Sales_2025, Sales_2024)

In this case, it returns only the rows in Sales_2025 that are also found in Sales_2024. Since the record with “D – West – $180” exists twice in Sales_2025, and also exists in Sales_2024, then both records are returned. So, while it might not be relevant for all datasets, order does matter when using INTERSECT.

3. EXCEPT – Returns Rows in One Table but Not the Other

The EXCEPT function returns rows from the first table that do not exist in the second.

DAX Syntax:

EXCEPT(<Table1>, <Table2>)

For our example, here is the syntax and resulting dataset:

ExceptTable = EXCEPT(Sales_2024, Sales_2025)

Only the rows in Sales_2024 that are not in Sales_2025 are returned.

If you were to reverse the order of the tables, you would get the following result:

ExceptTableReverse = EXCEPT(Sales_2025, Sales_2024)
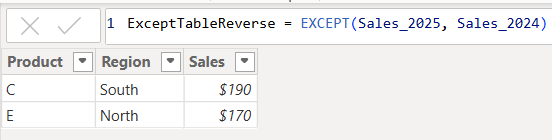
Only the rows in Sales_2025 that are not in Sales_2024 are returned. Therefore, as you have seen, since it pulls data from the first table that does not exist in the second, order does matter when using EXCEPT.

Comparison table summarizing the 3 functions:

FunctionUNIONINTERSECTEXCEPT
Purpose & OutputReturns all rows from both tablesReturns rows that appear in both tables (i.e., rows that match across all columns in both tables)Returns rows from the first table that do not exist in the second
Match CriteriaColumn position (number of columns) and datatypesColumn position (number of columns) and datatypes and valuesColumn position (number of columns) and datatypes must match and values must not match
Order Sensitivityorder does not matterorder matters if you want duplicates returned when they exist in the first tableorder matters
Duplicate HandlingKeeps duplicates. They can be removed by using DISTINCT()Returns duplicates only if they exist in the first tableReturns duplicates only if they exist in the first table

Additional Notes for your consideration:

  • Column Names: Only the column names from the first table are kept; the second table’s columns must match in count and data type.
  • Performance: On large datasets, these functions can be expensive, so you should consider filtering the data before using them.
  • Case Sensitivity: String comparisons are generally case-insensitive in DAX.
  • Real-World Use Cases:
    • UNION – Combining a historical dataset and a current dataset for analysis.
    • INTERSECT – Finding products sold in both years.
    • EXCEPT – Identifying products discontinued or newly introduced.

Thanks for reading!

How to enter data using DAX DATATABLE function in Power BI

I previously posted an article about how to manually enter data into Power BI using the Enter Data feature. That article can be found here: https://thedatacommunity.org/2024/08/03/how-to-enter-data-manually-and-update-it-in-power-bi/. This post shares how to use DAX to create a table with data in Power BI, an alternative way of creating data manually, which can be useful in many scenarios.

In Power BI Desktop, from the Table tools menu, click New Table:

Enter the code for the new table and data as shown in the example below:

The example code below shows the syntax for the DATATABLE function. You need to specify the table name (the name in the example below is “Games Table created using DAX”), and column names and their corresponding datatypes, and then provide the data as a list of values within braces to represent each row of data. STRING values are enclosed in quotes as usual.

Then click the checkmark to run the code/create the table with data.

When you review the table in the Table View, it will look like this, just like other tables look:

This table and data can then be used as any other table and data loaded into Power BI.

Thanks for reading. I hope you found this useful.

Data Cleaning methods

Data cleaning is an essential step in the data preprocessing pipeline when preparing data for analytics or data science. It involves identifying and correcting or removing errors, inconsistencies, and inaccuracies in the dataset to improve its quality and reliability. It is essential that data is cleaned before being used in analyses, reporting, development or integration. Here are some common data cleaning methods:

Handling missing values:

  • Delete rows or columns with a high percentage of missing values if they don’t contribute significantly to the analysis.
  • Impute missing values by replacing them with a statistical measure such as mean, median, mode, or using more advanced techniques like regression imputation or k-nearest neighbors imputation.

Handling categorical variables:

  • Encode categorical variables into numerical representations using techniques like one-hot encoding, label encoding, or target encoding.

Removing duplicates:

  • Identify and remove duplicate records based on one or more key variables.
  • Be cautious when removing duplicates, as sometimes duplicated entries may be valid and intentional.

Handling outliers:

  • Identify outliers using statistical methods like z-scores, box plots, or domain knowledge.
  • Decide whether to remove outliers or transform them based on the nature of the data and the analysis goals.

Correcting inconsistent data:

  • Standardize data formats: Convert data into a consistent format (e.g., converting dates to a specific format).
  • Resolve inconsistencies: Identify and correct inconsistent values (e.g., correcting misspelled words, merging similar categories).

Dealing with irrelevant or redundant features:

  • Remove irrelevant features that do not contribute to the analysis or prediction task.
  • Identify and handle redundant features that provide similar information to avoid multicollinearity issues.

Data normalization or scaling:

  • Normalize numerical features to a common scale (e.g., min-max scaling or z-score normalization) to prevent certain features from dominating the analysis due to their larger magnitudes.

Data integrity issues:

Finally, you need to address data integrity issues.

  • Check for data integrity problems such as inconsistent data types, incorrect data ranges, or violations of business rules.
  • Resolve integrity issues by correcting or removing problematic data.

It’s important to note that the specific data cleaning methods that need to be applied to a dataset will vary depending on the nature of the dataset, the analysis goals, and domain knowledge. It’s recommended to thoroughly understand the data and consult with domain experts when preparing to perform data cleaning tasks.

Transpose vs. Pivot vs. Unpivot in Power BI

In this post, I will quickly show how to perform 3 key transformations in Power BI – Transpose, Pivot, and Unpivot – and what impact they have on the data they are applied to. These transformations are often needed to manipulate the original data to get it into the shape needed to create the Power BI model and reports. We will use a simple example so that you can see clearly the effect of each transformation.

This is the original dataset – Student Grades:

Transpose

Transpose the data by going to the Transform ribbon and clicking “Transpose”.

This is what the data looks like after the Transpose transformation is applied. The rows are converted into columns, and the columns are converted into rows. Default headers / column names are applied.

Pivot Column

Starting with the original dataset, we will now Pivot the dataset. Go to Transform ribbon, click on “Pivot Column”.

The Pivot Column dialog opens. As noted, it will use the values in the Names column to create new columns, and will use the Score column as the Values Column.

This is what the data looks like after Pivot is applied as described above. Pivot Column converts the selected Name column values into column headers.

Unpivot Columns

Starting with the original dataset, we will now Unpivot the dataset. First select all 4 name columns by using “Ctrl + Click”.

Then, go to Transform ribbon, click on “Unpivot Columns”. This is what the data looks like after the Unpivot Columns transformation is applied. Unpivot Columns converts the selected columns (the name columns in this case) into a column of values (Attribute) and the column values are stored in the Value column.

Thanks for reading!

SQL Tips: How to rename a column in a table – Oracle database – Oracle SQL

At times you will need to change the name of a column in an existing table. If you are not changing the data type, it is just one statement / step that needs to be executed. However, I strongly recommend that you also do a backup step, especially if you’re making the change in a production environment, just in case of an unexpected issue.

If you choose to do the backup, you may perform this with a “create-table-as-select” statement in this form:

create table [table_name_backup] as select * from [table_name];

Here is an example of the above statement:

create table EMPLOYEES_BKUP as select * from EMPLOYEES;

Now that the table you are modifying is all backed up, you can proceed to rename the column.

The rename SQL statement would take this form:

alter table [table_name] rename column [existing_column_name] to [new_column_name];

An example of the statement:

alter table EMPLOYEES rename column SEX to GENDER;

Thanks for reading! I hope you found this information useful.

Oracle Error when table or other object has the same name as the schema name

We recently had a situation where a procedure was running fine in 2 environments but was failing in another. During debugging, it was determined that if the schema prefix was removed from the procedure call, it would run fine, otherwise it fails.

The following error was produced:

ERROR at line 1:

ORA-06550: line 1, column 14:

PLS-00302: component ‘MyProcedure’ must be declared

ORA-06550: line 1, column 7:

PL/SQL: Statement ignored

After some research, the DBA found a web post that indicated that this error is generated if you have an object with the same name as the schema.

You can check if you have any such objects by running this SQL command:

SQL> select * from dba_objects where object_name = ‘Your_Schema_Name’;

(of course, where “Your_Schema_Name” is the actual name of your schema)

If you do, then you should rename the object or remove it if it is no longer needed. Of course, if it is a valid object that is being used, you will need to rename it in all the places in which it is being used.

Thanks for reading! Good luck on your data journey!

SQL tips: Get last day and first day of month – Oracle SQL

At times you may need to dynamically determine the first or last day of a month based on the current date or some date in your data. This post provides a few options for deriving the First day of month, and Last day of month. And also, it provides a couple tweaks to get Last day of the next or previous month.

Get the current date (today’s date):
select sysdate from dual;

SYSDATE

16-MAY-22

Get the last day of the current month:
select trunc(last_day(sysdate)) as LastDayOfMonth from dual;

LASTDAYOFMONTH

31-MAY-22

Side note: The last_day() function can also be useful for dynamically determining leap years (that is, whether February has 28 or 29 days)
select
last_day(date ‘2020-02-01’) LastDayOfFeb2020, — leap year
last_day(date ‘2021-02-01’) LastDayOfFeb2021 — not a leap year
from dual;

LASTDAYOFFEB2020 LASTDAYOFFEB2021

29-FEB-20 28-FEB-21

Get the last day of the next month:
select add_months(trunc(last_day(sysdate)), 1) as LastDayOfNextMonth from dual;

LASTDAYOFNEXTMONTH

30-JUN-22

Get the last day of the previous month:
select add_months(trunc(last_day(sysdate)), -1) as LastDayOfPreviousMonth from dual;

LASTDAYOFPREVIOUSMONTH

30-APR-22

Get the first day of the current month:

select trunc(sysdate,’month’) as FirstDayOfMonth from dual;
select trunc(sysdate,’MM’) as FirstDayOfMonth from dual;

FIRSTDAYOFMONTH

01-MAY-22

Get the first day of the next month:

select add_months(trunc(sysdate,’MM’), 1) as FirstDayOfNextMonth from dual;

FIRSTDAYOFNEXTMONTH

01-JUN-22

You can also get the first day of the next month using this:
select trunc(last_day(sysdate)+1) as FirstDayOfNextMonth from dual;

FIRSTDAYOFNEXTMONTH

01-JUN-22

Get the first day of the previous month:

select add_months(trunc(sysdate,’MM’), -1) as FirstDayOfPreviousMonth from dual;

FIRSTDAYOFPREVIOUSMONTH

01-APR-22

Here are 3 resources for getting the first and last day of the month values on a SQL Server database:

https://zarez.net/?p=2462

Thanks for reading! I hope you found this information useful!

Good luck on your data journey.

SQL Tips: How to replace a character or a part of a string in a column value – Oracle SQL

If you frequently work with data, you will occasionally need to replace a part of the values in a column for some reason. In our case, we recently had some data that was loaded into a table from a file source and all the values had an unwanted leading and trailing tab character.

We needed to remove these tabs and preferably without resourcing and reloading the data. The solution was to use the REPLACE SQL function.

This is the form of the UPDATE statement that uses the REPLACE function

Update TABLENAME Set COLUMN_TO_BE_UPDATED = REPLACE(COLUMN_TO_BE_UPDATED, ‘Char_or_String_to_replace_in_column_values’, ‘Char_or_String_to_replace_it_with’);

Here is an example that replaces the long street names in the ADDRESS column with their abbreviated corresponding name:

update EMPLOYEE set ADDRESS = REPLACE(ADDRESS, ‘Street’, ‘St’ ), ADDRESS = REPLACE(ADDRESS, ‘Avenue’, ‘Ave’ ), ADDRESS = REPLACE(CITY, ‘Circle’, ‘Cir’ ) where COUNTRY = ‘United States’;

To solve the issue we had, the SQL statement below was used to update the EMPLOYEE column values by replacing the tab character with NULL – as shown below.

Important Note: Before making any major updates to a table, it’s a best practice to back up the table first.

update EMPLOYEE_EXPENSE_DATA set EMPLOYEE = REPLACE(EMPLOYEE, ‘    ‘, NULL) where EMPLOYEE like ‘  %’;

Important Note: Verify your update before you commit the changes.

We repeated this SQL for each column that had the “bad” (unwanted leading and trailing tabs) values.

Thanks for reading! I hope you found this information useful.

SQL Tips: How to generate a delimited list from the values in an Oracle database table column

This is a quick post that shows how to generate the values from a table column in a delimited list format.

If you have a table named CONTACTS that has the following columns and values:

select * from CONTACTS;

And you wanted to generate a delimited list of the names in the NAMES column like this:

Adam, Jane, John, Lisa, Mark, Mary, Noah

Or like this:

Adam | Jane | John | Lisa | Mark | Mary | Noah

You would use SQL statements like these to generate the above output – note the delimiter in each case, and also note that you can sort the output:

— comma delimiter example …

SELECT listagg(NAME, ', ') within group (order by NAME) FROM CONTACTS;

Adam, Jane, John, Lisa, Mark, Mary, Noah

— pipe delimiter example …

SELECT listagg(NAME, ' | ') within group (order by NAME) FROM CONTACTS;

Adam | Jane | John | Lisa | Mark | Mary | Noah

You can find more information about the listagg function here.

Thanks for reading. I hope you found this useful.

Python Libraries for Data Science

Python has grown quickly to become one of the most widely used programming languages. While it’s a powerful, multi-purpose language used for creating just about any type of application, it has become a go-to language for data science, rivaling even “R”, the longtime favorite language and platform for data science.

Python’s popularity for data-based solutions has grown because of the many powerful, opensource, data-centric libraries it has available. Some of these libraries include:

NumPy

A library used for creating and manipulating multi-dimensional data arrays and can be used for handling multi-dimensional data and difficult mathematical operations.

Pandas

Pandas is a library that provides easy-to-use but high-performance data structures, such as the DataFrame, and data analysis tools.

Matplotlib

Matplotlib is a library used for data visualization such as creating histograms, bar charts, scatter plots, and much more.

SciPy

SciPy is a library that provides integration, statistics, and linear algebra packages for numerical computations.

Scikit-learn

Scikit-learn is a library used for machine learning. It is built on top of some other libraries including NumPy, Matplotlib, and SciPy.

There are many other data-centric Python libraries and some will be introduced in future articles. More can be learned here: https://www.python.org/