Category: Analytics

HR Analytics | People Analytics | Workforce Analytics: The Employee Life Cycle and metrics for evaluating each stage

The employee life cycle, the journey of a person from “a potential candidate who applies for a job at a company at some point” to “becoming an employee of the company” to “eventually leaving the company”, consists of 6 stages. In this article I will describe the stages of the employee life cycle and will also describe a few metrics that can be used to evaluate how the organization is doing at each stage. These metrics will allow HR teams (and others) to understand how things are going at each stage so that they can make data-driven decisions to improve outcomes. As I described in more detail in another article, “What is HR / People / Workforce Analytics?”, examples of the “outcomes” that companies seek to improve, include but are not limited to: successful hiring, reduced costs, high employee engagement, reduced absences, high employee productivity, low turnover or high retention (especially of top talent), accurate staff forecasting, and attributable business impact.

While the metrics covered here are relevant in almost all companies, these are just examples of some of the possible metrics. There are many other metrics that a company could track, and other metrics may be more relevant in your organization, and you would therefore use those metrics to guide the management of the stages. The main idea here is to identify the metrics for each stage that are important to your organization and use them to help manage your life cycle using data and not just intuition.

Another thing to keep in mind is, you must have the relevant data to generate the metrics you are interested in tracking. Once you determine the metrics that are important to you, then you need to make sure the data needed to generate those metrics is available in some form, otherwise a plan must be devised to start generating, capturing, and storing the necessary data.

The Stages

The Employee Life Cycle has 6 stages. They are (1) Attracting/Recruitment, (2) Hiring, (3) Onboarding, (4) Development, (5) Engagement/Retention, and (6) Separation.

The Employee Life Cycle with its 6 stages

Each stage is important and, with the right data, can provide insight into how effective your organization is at making the best of its most important and valuable resource (its employees). Let’s take a look at each stage in more detail.

Stage 1: Attracting / Recruitment

The Attracting/Recruitment stage of The Employee Life Cycle

In this stage, organizations engage in indirect and direct efforts to attract and recruit candidates. Organizations will make efforts to build their brand as a great company and employer which will attract potential candidates with a desire to work there. They will also perform direct recruiting efforts such as job postings, job fairs, recruiting events, college outreach, and more. Companies generally desire to have a robust pool of potential candidates and a solid number of applicants for their open positions. It is important to know if you are attracting the right candidates, recruiting in the right places and with the best mediums, and using effective methods.

Below are a few metrics that can be used to analyze how things are going at this stage. You will use metrics relevant to tracking and meeting your company’s recruitment goals.

Attracting / Recruitment Metrics

MetricDescription and commentary
Average recruiting cost per hireWhat the organization spends on average in recruitment to fill a position. If this number is too high, a company will need to find ways to lower the cost by implementing new recruiting methods or eliminating some methods.
Average length of hiring cycleMeasured from the date HR is asked to fill a position to the date the new hire starts the job. So, this metric spans more than just the recruitment stage. If this length of time is too long or has started trending in the wrong direction, the recruiting team can examine to determine where the delays are coming from and take necessary action if it turns out to be a result of the attracting/recruiting efforts.  
On-time talent delivery factorAverage number of days that newly hired employees’ start dates differs from the need-by date listed on the requisition requesting the hire. If this metric shows that on-time delivery is low, then the team needs to examine things like … Are we attracting the wrong applicants or in other words, are we attracting quality candidates? Are our job postings effective? Are we recruiting with the right frequency and using the right mediums/methods?
Recruitment source ratioThis metric is calculated by: Internal hires/External hires
This will shed light on if the company is “recruiting” internally, and also if they are developing internal people properly and encouraging internal mobility. A high Recruitment Source Ratio is a good sign that employees want to stay with the company and have opportunities for growth and mobility, which will help the company’s brand as an “employer of choice”.
Offer Acceptance RateWhat percentage of candidates accept job offers presented by the company. This is calculated by: Offers accepted/Offers made x 100.
The aim is to get this number as close to 100% as possible. While this metric is most relevant in the Hiring stage, it is also important for team members that monitor the Recruitment stage to pay attention to this metric to determine if any changes need to be made in Recruiting before the person moves to the Hiring stage. For example, if this metric is too low, it might be relevant to investigate if Recruiting is setting the wrong expectations which don’t materialize for the candidate in the Hiring stage.
Internal Hire rateThe percentage of hires that are internal hires.
This metric provides similar insights as the Recruitment Source Ratio metric and will let you know if your company is attracting qualified internal candidates for open positions and supporting internal mobility.
Number of applicants per job listingThe number of applicants applying to each job. This will shed light on your company’s recruiting power. It will also show which jobs may need unique recruiting approaches.
% of diverse applicantsThe percentage of applicants that are diverse. This metric will help you to track if your recruiting efforts are supportive of your diversity goals.

Stage 2: Hiring

The Hiring stage of The Employee Life Cycle

This is where an organization interviews, selects, extends offers to, and hires candidates to join their staff. This is an important stage because hiring the “right” people is critical to the success of any company. But it’s also important to make sure that applicants not selected are also handled properly by the process.

Below are a few metrics that can be used to analyze how things are going at this stage. You will use metrics relevant to tracking and meeting your company’s hiring goals.

Hiring Metrics

MetricDescription and commentary
Headcount & Headcount demographicsThe number of employees in the company; and the number of employees broken out by various demographic and organizational values. This helps a company to see if headcount is shrinking, growing, or stable, and if the headcount is within the company’s or division’s target ranges. This will also shed light on the diversity makeup of the employees across the company and across smaller org units within the company.
# of new hiresThe number of new hires within some timeframe (month, quarter, year). This metric can help companies prepare for new employees. It may also lead to investigative questions like … why are we hiring so much? Or why has hiring dropped so much? This metric can also be analyzed in comparison to terminations, as in the Net Hire Ratio metric described below.
Time to hireThe time it takes from the job posting to a hire for the position. This is an indication of the strength of the company’s candidate pool and how efficient their recruiting and hiring processes are.
Offer acceptance rateThis metric was also included in the Recruitment stage.
The percentage of candidates that accept job offers presented by the company.  
It is often calculated as: Offers accepted/Offers made x 100  
The aim is to get this number as close to 100% as possible.
If this number of low or trending down, the HR Teams can investigate to identify the causes and determine possible actions for improvement.
Net hire ratioThe ratio of the number of employees joining the organization to the number leaving. If this ratio is greater than 1 then more people are joining than those leaving, and it’s the opposite if this ratio is less than 1.  
It is calculated by: External hires/Terminations
New hire turnover contributionThis metric provides the percentage of total terminations that is attributable to the termination of short-tenure employees.
If this number is high, then HR needs to examine recruiting, hiring, onboarding, and early development stages.
Performance of new hires in first yearThis metric provides a measure of the performance of new hires.
Implementing programs to drive high performance in new employees will reduce turnover and likely improve overall outcomes for the company.
New hire Turnover rate (3 months, 6 months, first year, 2 years)This is a measure of the percentage of new hires that are leaving the company. And this should be tracked at various tenure marks and across relevant dimensions (such as your various orgs and jobs). This is another way to measure the quality of new hires and can be very useful to identify where you might be having a new hire turnover issue.
Cost per hireThis measures how much it is costing to hire each employee. Tracking this metric allows HR departments to easily recognize when they may need to make adjustments in the hiring process to reduce costs. This metric is also important for some ROI analyses.
Average cost of a bad hireMeasures the cost of hiring employees that did not work out. Breaking this down by department, position, and other dimensions is most useful and hits home with the importance of hiring “right”.
New hire satisfaction indexThis metric measures if new hires are satisfied with their job. This metric’s data is usually derived from surveys. This metric will shed light on new hire turnover, and quality of hire metrics. This will help to identify if changes are needed in the recruiting, hiring, onboarding, or developments processes.
Manager satisfaction with new hires indexThis metric measures the satisfaction of managers with new hires reporting to them. The data for this metric is usually derived from surveys. This metric can be compared to the “New hire satisfaction index” metric to see if these 2 perspectives are in sync or if they diverge. This will help to identify if changes are needed in the recruiting, hiring, onboarding, or developments processes.
Quality of hireThis is a measure of the value new hires bring to a company or in other words, a measure of whether new hires turned out to be good hires. How companies measure this will vary. Most will use tenure/turnover data, and some may also include employee performance data, and even employee and manager satisfaction data, and exit survey data.
Internal Hire rateThe percentage of hires that are internal hires.
This metric will let you know if your company is attracting qualified internal candidates for open positions and supporting internal mobility.
% of new hires that are diverseThe percentage of new hires that are diverse. This metric will help you to track if you are meeting your diversity goals.

Stage 3: Onboarding

The Onboarding stage of the Employee Life Cycle

In this stage, an organization “onboards” newly hired employees. This includes setting up the new employees with access to buildings and networks, providing information about the company’s operations, culture, and more, and providing information about benefits, intranets, etc., and potentially introducing them to key leaders. The whole idea here is to transition the new employee into the company as smoothly as possible, with relevant knowledge to get started efficiently, and with the right expectations and mindset based on the company’s goals and culture. The first few weeks on the job is a very important phase and can “make or break” the success of new employees. It takes time to get new hires to be productive, and therefore, it’s very costly when an organization loses these new hires quickly.

Below are a few metrics that can be used to analyze how things are going at this stage. You will use metrics relevant to tracking and meeting your company’s onboarding goals.

Onboarding Metrics

MetricDescription and commentary
Onboarding satisfactionThe sentiment of new hires after the onboarding process is complete. This metric will usually be derived from survey data. Sometimes the satisfaction of the hiring managers is also tracked. This metric will shed light on whether changes are needed in the onboarding process.
New hire turnover (or new hire retention)This metric provides the percentage of total terminations that is attributable to the termination of new or short-tenure employees, where the tenure term is usually tracked at various marks, such as 3 months, 6 months, and 1 year. If using the “retention” metric, then it’s the opposite, which is … the percentage of new employees that remain with the company. And this can also be tracked at various tenure marks.
Retention thresholdThis metric tracks the threshold points at which employees are leaving. It may help to identify if you have a problem at specific tenure points, perhaps in specific roles or departments, which will allow a company to analyze more closely and determine what actions may help to address the situation.
Time to productivityThis is a measure of the time it takes to make an employee productive. This will vary by job and so it’s best to be able to measure and use it accordingly. This metric is useful for identifying what changes might be needed in the onboarding process to shorten this time. The metric can also be used for setting expectations for employees and managers.
Cost to productivityThis is the cost version of the “Time to productivity” metric. It is a measure of the costs involved in making an employee productive (cost of training and more). Similarly, this metric is useful for identifying what changes might be needed in the onboarding process to shorten this time and lower the costs.
Training completion rateThe percentage of employees completing their required training in the allotted time. Depending on the nature of the organization, this could be a critical metric and will shed light on what changes may be needed in the new employee training process or content.
Average onboarding costs per hireThe amount an organization spends on onboarding after filling a position with a new hire. This will help HR teams to determine if changes are needed to the process.

Stage 4: Development

The Development stage of the Employee Life Cycle

During this stage, organizations provide training and development opportunities for the employees including formal training, on the job training, documentation, opportunities to use new knowledge, mentoring, along with all other relevant pieces to help employees be as productive as possible in their jobs. The initial and ongoing development of employees is critical to the confidence, performance, and success of the employees on the job.

Below are a few metrics that can be used to analyze how things are going at this stage. You will use metrics relevant to tracking and meeting your company’s development goals.

Development Metrics

MetricDescription and commentary
Employee productivityThis is a measure of how productive employees are in their respective roles, and how productive employees are overall toward the goals and expectation of the company. This metric may shed light on, for example, if training is not effective or if additional trainings are needed, if the company’s culture is affecting performance, or if process or organizational changes are impacting employees, among other things. Anything negatively impacting productivity should be addressed with the highest priority.
Employee satisfaction with job/roleThis metric identifies how satisfied employees are with their job. As you can imagine, unsatisfied employees lead to a whole set of issues, including the failure of the company to meet its goals. This is usually measured using surveys, one-on-one interactions, and potentially social media data.
As with Employee Productivity, anything negatively impacting Employee Satisfaction should be addressed with the highest priority.
Employee performanceThis is a measure of how employees are performing in their respective roles. This is similar to the “Employee productivity” metric. Are employees performing at or above expectations? If not, what can be done to improve the situation?
Training completion rateA measure of the percentage of employees that are completing the required trainings. This may provide insight into questions like: Do we need to make changes to the training (content, delivery, timing)?  Is there a correlation between completed training and job performance?
Training completion timeA measure of the time it takes to complete training. This metric will be a part of what makes up the “Time to productivity” metric. Monitoring this metric will provide insight into whether this metric is trending up or down, and what changes may be needed to the training programs.
Training effectivenessA measure of how effective the new employee training is. Monitoring this metric will provide insight into what changes may be needed to the training programs.
Training expense per employeeA measure of how much training costs per employee. This metric will become a part of what makes up the “Cost to productivity” metric. This metric will be useful for identifying employee ROI. If this metric is trending up, it needs to be investigated to understand why and make adjustments as necessary.
Time to productivityThis metric is also in the Onboarding stage but for some jobs/companies, it goes beyond onboarding to get to full or acceptable productivity. This is a measure of the time it takes to make an employee productive. This will vary by job and so it’s best to be able to measure and use it accordingly. This metric is useful for identifying what changes might be needed in the onboarding and development stages to shorten the time. The metric can also be used for setting expectations for employees and managers.
Cost to productivityThis metric is also in the Onboarding stage but for some jobs/companies, it takes beyond onboarding to get to full or acceptable productivity. This is the cost version of the “Time to productivity” metric. It is a measure of the costs involved in making an employee productive (cost of training and more). Similarly, this metric is useful for identifying what changes might be needed in the onboarding and development stages to shorten the time and lower the costs.
Revenue per employeeThis measures how much revenue the company generates per employee. Ideally, this metric should be trending up, but is acceptable to be going down during growth initiatives with lots of hiring. This metric will be useful for identifying employee ROI.

Stage 5: Engagement / Retention

The Engagement/Retention stage of the Employee Life Cycle

This is typically the longest stage of the employee life cycle, potentially spanning many years.  In this stage, an organization will monitor the employees’ performance and provide competitive salaries, benefits, learning and development opportunities, growth opportunities, recognition, rewards such as bonuses, and take other steps to grow and retain effective employees. This stage could span years and includes many activities that need to be measured and monitored.

Below are a few metrics that can be used to analyze how things are going at this stage. You will use metrics relevant to tracking and meeting your company’s retention goals.

Engagement / Retention Metrics

MetricDescription and commentary
Retention rateThis measures the percentage of employees that stay with the company. It is the opposite of “Turnover rate”.  
It is often calculated as: (Starting headcount + external hires – terminations)/(Starting headcount + external hires) x 100
Key employee retention rateThis is the same as “Retention rate” but limited to those defined as key employees or high-performing employees or top-talent employees. Obviously, companies are most concerned about retaining their key talent. Any decline in the retention rate of key employees must be analyzed carefully and acted upon, if necessary, with a high priority.
Average retention periodAverage amount of time employees stay in their positions (typically broken down by department and position). This metric can be analyzed alongside satisfaction and performance metrics.
Turnover rate Voluntary turnover rate / Involuntary turnover rate (also called Attrition rate)This measures the percentage of employees leaving the organization. This metric is the opposite of “Retention rate”.
It is often calculated as: (Terminations/Average headcount) x 100
And it is typically broken out by Voluntary and Involuntary Terminations. As with many other metrics, this will be most insightful when broken out by time, org (region, department, etc.), manager, termination reasons, and other dimensions.
Employee retention indexThis metric measures how likely employees are to stay with the organization. The data for this metric typically comes from surveys.
This metric sheds light on if changes are needed to the current retention efforts.
Employee satisfactionThis metric measures employee overall satisfaction. Employee satisfaction has a direct and significant impact on a company’s success.  This is usually measured using surveys, one-on-one interactions, and potentially social media data. This measure should be tracked by org, and by role. And it should also be tracked with whether there have been recent major organizational or process changes.
Employee performanceThis metric is also included in the Developing stage of the life cycle. This is a measure of how employees are performing in their respective roles. Are employees performing at or above expectations? If not, what can be done to improve the situation?
Talent turnover rateThis is the opposite of the “Key employee retention rate “ metric listed earlier, but measures turnover of key employees as opposed to retention of those employees. Obviously, companies are most concerned about reducing the turnover of their key talent.
Time since last promotionThe time since an employee was last promoted. This metric can provide insight into what impact promotions may have on areas such as turnover/retention, employee satisfaction, and performance.    
Time since last salary increaseThe time since an employee last received a salary increase. This metric may provide similar insights as the “Time since last promotion” metric. This metric can provide insight into what impact raises may have on areas such as turnover/retention, employee satisfaction, and performance.
Absence rateThis metric measures how often employees are absent from work. Like many other metrics, this will be most insightful when viewed by various dimensions, such as by org or by manager. High absence will undoubtedly impact the company’s overall performance and must be addressed when necessary.
Overtime hoursThe is the amount of overtime hours worked by employees. A high amount of overtime is not necessarily bad, as it may be a result of business growth, but on the other hand, it may indicate problems with inefficient scheduling or overtime abuse. Another consideration is checking the impact overtime has on turnover and employee satisfaction.
Revenue per employeeThis measures was also included in the “Development” stage of the life cycle. It measures how much revenue the company generates per employee. Ideally, this metric should be trending up, but is acceptable to be going down during growth initiatives. This metric will be useful for ROI analyses.
Time to resolution of HR casesThis measures how quickly HR cases are resolved. This can impact employee satisfaction and therefore, is important to track and monitor.

Stage 6: Separation

The Separation stage of the Employee Life Cycle

This is where the employee and the organization separate. The termination may be voluntary (the employee decided to leave the organization), or it may be involuntarily (the organization decided the employee must leave).

Below are a few metrics that can be used to analyze how things are going at this stage. You will use metrics relevant to tracking and meeting your company’s separation goals.

MetricsDescription and commentary
Turnover Rate (also called Attrition rate)   Voluntary Turnover Rate or Voluntary Attrition RateThis metric is also included in the Engagement/Retention stage. It measures the percentage of employees leaving the organization. It is often calculated as: (Terminations/Average headcount) x 100 And is typically broken out by Voluntary and Involuntary Terminations As with many other metrics, this will be most insightful when broken out by time, org (region, department, etc.), manager, termination reasons, and other dimensions.
TenureThe length of time that an employee is with the company. Analyzing tenure by various dimensions and how it correlates with other metrics can lead to insights.
Overtime HoursThis metric is also included in the Engagement/Retention stage. It measures the amount of overtime hours worked by employees. A high amount of overtime could be a cause of employee dissatisfaction and lead to increased turnover. This should be asked in exit surveys, but also be tracked using hours worked data.
Employee performanceThis metric is also included in the Development stage and the Engagement/Retention stage of the life cycle. This is a measure of how employees are performing in their respective roles. Are employees performing at or above expectations? Are we losing high performers or low performers?
Time since last promotionThis metric was also included in the Engagement/Retention stage. It is the time since an employee was last promoted. This metric can provide insight into what impact promotions may have on areas such as turnover/retention, employee satisfaction, and performance. Are employees quitting because of a lack of vertical career growth potential and going to other companies that are perceived to have such potential?
Time since last salary increaseThis metric was also included in the Engagement/Retention stage. It may provide similar insights similar to the “Time since last promotion” metric. The time since an employee last received a salary increase. This metric can provide insight into what impact raises may have on areas such as turnover/retention, employee satisfaction, and performance. Are employees competitively paid? Are employees quitting to go to other jobs with higher pay?
Employee satisfactionThis metric was also included in the Engagement/Retention stage. It measures employee overall satisfaction. Employee satisfaction has a direct and significant impact on a company’s success.  This is usually measured using surveys, one-on-one interactions, and potentially social media data. This measure should be tracked by org, and by role. And it should also be tracked with whether there have been recent major organizational or process changes.

Summary

We went through each stage of The Employee Life Cycle and a sampling of relevant metrics that can be used to manage each stage. Throughout the employee life cycle, the appropriate HR teams need to track and monitor the relevant metrics at each stage and use that information to continuously manage the processes toward improvement. Note that issues in one stage will sometimes affect other stages. For example, if a company develops a reputation of not investing in training for employees (Onboarding and Development stage) which leads to an inefficient and stressful work environment (Engagement/Retention), then this may also lead to higher-than-normal turnover (Separation stage) and may impact the company’s ability to attract and recruit top talent (Attracting/Recruitment stage), among other things.  

Keep in mind that the above sets of metrics do not include all HR metrics. These are examples of some common metrics that are most likely relevant to a company, with their definitions and additional commentary to show how you can use metrics at each stage to better manage your HR processes and activities. There are many other HR metrics that may be more relevant to your company.

Also, remember that each metric (where it makes sense) should be analyzed across a variety of relevant dimensions. For example, just about all metrics should be analyzed over the dimension of time, because looking at turnover rates over all-of-time will not be as insightful as looking at it by month. Another example is, Employee Performance can be analyzed at the company level, but can be more insightful when analyzed by departments or by roles or both.

Thanks for reading! I hope you found this information useful.

What is HR / People / Workforce Analytics?

An organization’s most important resource is its staff. Understanding how to take the best care of your staff and help them to be highly engaged and productive is key to the success of the organization. HR Analytics / People Analytics / Workforce Analytics can help with this. But what is that exactly?

Analytics is a multi-disciplinary field that involves the collection and curation of data, and the analysis of that data using a variety of methods and tools, to discover, interpret and share information and insights, to help develop better business understanding and help guide decision making, usually toward achieving an organization’s goals. HR / People / Workforce Analytics is analytics around an organization’s candidates and staff, and HR actions and operations. The term most commonly used for this area of specialization by people in the field has shifted from HR Analytics to People Analytics over the years, and is now trending toward Workforce Analytics, so I will just use Workforce Analytics for the rest of the article.

The data used for Workforce Analytics will come from many sources inside and outside the organization including, but not limited to, Human Capital ERP systems, Workforce applications, Recruiting applications, Payroll applications, scheduling applications, employee and candidate surveys, social media, Glassdoor, and more. This data can be transformed, integrated and aggregated as appropriate, and then analyzed to provide information to help with operational and strategic decision making around areas such as staffing, recruiting, retention, turnover, absence, compensation and benefits, employee engagement, job satisfaction, performance and productivity, training and development, diversity, equity and inclusion, and operational efficiency, among others.

This analysis is usually performed across time periods (months, years) to allow for period-to-period comparisons and trend analysis to determine if the various metrics being measured and analyzed are improving or not. And the analysis is also usually done across all levels of the organization, so that information is available to support decision making for the entire organization or for a single department or for a specific segment of employees (such as all the clinical employees within a healthcare organization) or potentially for an individual employee.

The end goal usually includes helping with efforts such as:

  • Understanding the current workforce landscape and knowing any operational tasks that need to be performed
  • Hiring better candidates by predicting candidate success and reducing recruiting/hiring costs
  • Improve employee engagement through a better understanding of employee’s true needs, and what is working and what is not, and reducing absences as a result
  • Increase employee productivity through a better understanding of how employees work and things that slow them down
  • Reducing turnover by predicting employees at a high risk of turnover and implementing proactive retention measures
  • Forecast future staffing needs to better prepare for it with recruiting and training & development
  • Determining the business impact of HR initiatives

The diagram below summarizes the Workforce Analytics components to give you an overview of this article in a quick glance.

Of course, all organizations are different, and so the goals of an organization, the type of data available and the type of analyses of interest to an organization, will vary. But the importance and value of Workforce Analytics, which helps organizations make the most of their most important resource, is critical to just about all medium to large organizations, regardless of industry and prior success.

Good luck on your analytics journey!

The 5th type of analytics – cognitive analytics

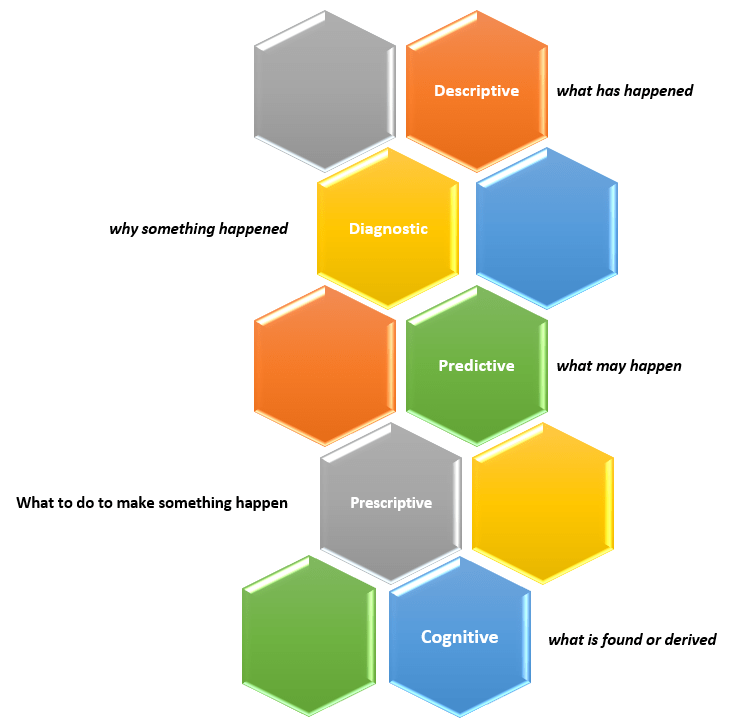
Sometime ago, I wrote an article titled “What is data analytics? And what are the different types of data analytics?”. In that post, I described four types of analytics:

  • Descriptive Analytics – what has happened?
  • Diagnostic Analytics – why something happened?
  • Predictive Analytics – what may happen (in the future)?
  • Prescriptive Analytics – what to do to make something happen?

You can read that full article here.

New capabilities and solutions have led to a new classification of analytics called Cognitive Analytics.

Cognitive Analytics involves bringing together technologies such as Artificial Intelligence (AI), Machine Learning (ML), and Deep Learning to apply human-like behavior to data tasks at unhuman scale, such as, searching through massive amounts of data and making sense of its contexts and be able to provide information from it, such as a likely answer or a sentiment score. This form of analytics provides new solutions that do not fit into any of the other four classifications and, in short, can be dubbed as “what is found or derived“.

There are many use cases that could benefit from this type of analytics, such as, personalization of services at scale, and improved customer service efficiency.

Thanks for reading and best wishes on your data journey!

Why I am excited about using Microsoft Power BI

Our team at work recently started using the Power BI platform. We are just getting going but I am already loving this tool. Our current enterprise BI platforms are Qlik and OBI (Oracle Business Intelligence), however, Power BI has has gained significant traction in business teams over the last couple years where it used for departmental reporting and analysis.

I see why the business teams love this tool and am excited about bringing it into our portfolio of tools for delivering analytic solutions across the company. These are some of the reasons I like Power BI:

  • First and foremost, we have not yet come across anything that we currently do in Qlik or OBI that we will not be able to do in Power BI. This was very important.

Power BI has a very intuitive and well laid out interface. You can easily switch between the visualizations, the data, and the data model. And within each of those tabs, you easily navigate using the well-placed objects and menu items. I found the interface easy to get accustomed to.

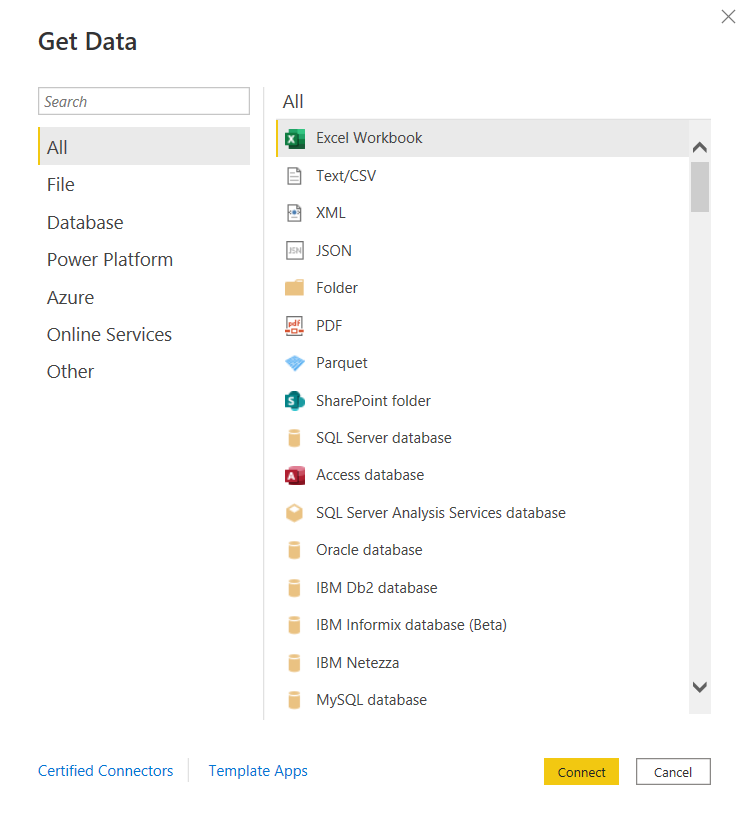
  • You can connect to just about any data source. The list is long. It seems the only source missing is an alien database on Mars. 🙂 I am kidding, but I did not find a native connector for Informix – the most uncommon database that we currently have as a source, but of course, ODBC and JDBC are available for those scenarios. Take a look.

and there are many more!

Some notable connectors are SQL Server Analysis Services, PostgreSQL, Amazon Redshift, Google BigQuery, Snowflake, various Azure data sources, Salesforce, Spark, GitHub, Databricks, and many more.

  • There are many awesome features for handling Excel data. And although we try to avoid Excel data as a source, it’s just not possible at times, and sometimes it makes sense to use those sources. However, the Power Query functionality allows users to perform ETL tasks on any data from any source.
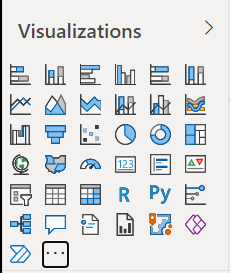
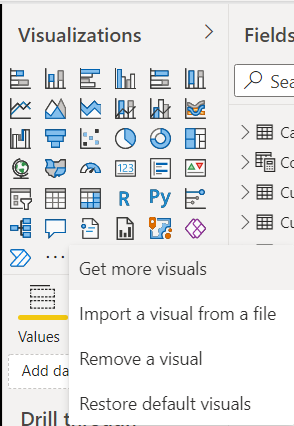
  • Power BI has many built-in visualization options.

And you have the ability to “get more” from the marketplace.

  • Data modeling in Power BI is based on a methodology that our team is very familiar with: Dimensional Modeling, also known as, Star-Schema Modeling. And this is a proven method that works for efficient analytic solutions. In Power BI, it is also easy to create relationships between tables, change data types, and build hierarchies.
  • Within the data models, you can also use a versatile language called DAX (Data Analysis Expressions) to manipulate data, filter data, build measures, and more. I find that what’s possible with DAX brings Power BI into a whole other tier of flexibility compared to other tools. There is a bit of a learning curve for DAX, but you can start by focusing on a few key functions, and then expand your knowledge over time.
  • As you would expect in any modern BI platform, the security features in Power BI provide for object-level and data-level security. We have set up some simple security scenarios so far and it was straightforward. We will be digging more into setting up some more complex security scenarios soon and will report on that experience.
  • Data profiling features are built into Power BI, which may save you some time from having to jump into another query tool to profile your data.
  • Along with some standard analytic features, such as TopN, conditional formatting, and aggregate functions, Power BI also offers AI visuals, R and Python visuals, and advanced algorithms (such as key influencers and outliers) are available. I can foresee us using these features in the future.
  • Integration options with Office 365, SharePoint, and Teams.
  • Power BI is a great platform for one of the most significant trends in analytics – that is, users clamoring for Self-Service Analytics. With the ability to easily secure and share Power BI datasets, and users able to easily connect and use that data with an intuitive, optional code, tool that they may already have exposure to, it will be easier to implement self-service solutions. There are also some cool features for report consumers, such as personalization of visuals and mobile view.
  • A company called P3Adaptive delivered an awesome training for us, but there are tons of free resources available for learning. A good place to start is the Power BI lessons on Microsoft Learn – Power BI. And then, sign up for Dashboard in a Day (DIAD), a free one-day instructor-led training. You can find and register for DIAD classes here: Microsoft Events – DIAD
  • There are reasons why the Power BI platform has been at the top of the “Gartner Magic Quadrant for Business Intelligence and Analytics Platforms” for the last 3 years. It has a lot going for it and the company seems to be aggressive about continuous improvement.

I look forward to the Power BI journey and the ongoing quest to make our data as valuable as possible for our company.

Unable to save analysis with HTML markup in OAS after upgrade from OBIEE

We recently upgraded from OBIEE 12 to OAS 5.5. (Oracle Business Intelligence to Oracle Analytics Server). After the upgrade, we were not able to save analyses that contained HTML markup. We were able to do this before the upgrade.

Turns out, the configuration parameter for this now needs to be set in the new analytics/systemsettings page. Go to that page and enable the option “Allow HTML Content”. Then restart by clicking on the Restart button on that page.

After a restart, it resolved the issue for us.

If this doesn’t resolve it for you, you may need to remove the parameter from the instance config file and try again.

Back up your instanceconfig.xml file. Then edit it by removing the element “EnableSavingContentWithHTML” from the Security section and save the file. You will be removing a line that looks something like this:

“<EnableSavingContentWithHTML>true</EnableSavingContentWithHTML>”

Then go back to the analytics/systemsettings page, confirm “Allow HTML Content” is enabled, and restart again. This hopefully should resolve your issue.

Python Libraries for Data Science

Python has grown quickly to become one of the most widely used programming languages. While it’s a powerful, multi-purpose language used for creating just about any type of application, it has become a go-to language for data science, rivaling even “R”, the longtime favorite language and platform for data science.

Python’s popularity for data-based solutions has grown because of the many powerful, opensource, data-centric libraries it has available. Some of these libraries include:

NumPy

A library used for creating and manipulating multi-dimensional data arrays and can be used for handling multi-dimensional data and difficult mathematical operations.

Pandas

Pandas is a library that provides easy-to-use but high-performance data structures, such as the DataFrame, and data analysis tools.

Matplotlib

Matplotlib is a library used for data visualization such as creating histograms, bar charts, scatter plots, and much more.

SciPy

SciPy is a library that provides integration, statistics, and linear algebra packages for numerical computations.

Scikit-learn

Scikit-learn is a library used for machine learning. It is built on top of some other libraries including NumPy, Matplotlib, and SciPy.

There are many other data-centric Python libraries and some will be introduced in future articles. More can be learned here: https://www.python.org/

What is data analytics? And what are the different types of data analytics?

Data analytics is the overall process of capturing and using data to produce meaningful information, including metrics and trends, that can be used to better understand events and help make better decisions. Usually the goal is to improve the efficiency and outcomes of an operation, such as a business, a political campaign, or even an individual (such as an athlete). There are four (4) prevalent types of data analytics – descriptive, predictive, diagnostic, and prescriptive.

  1. Descriptive analytics – provides information about “what has happened”. Examples of questions answered by descriptive analytics include: How much are our sales this month and what is over year-over-year sales increase? How many website visitors did we have and how many signups?
  2. Predictive analytics – provides insight into “what may happen” in the future based on the past. Examples of questions answered by predictive analytics include: Based on previous customer service call patterns and outcomes, what is the likelihood of a customer switching to another provider? Based on a customer’s profile, how much should we charge him for insurance?
  3. Diagnostic analytics – provides information to explain “why something happened”. In addition to the direct data, this may also involve more indirect or macro data sources, such as, weather data, local or national economic data, or competitor data. And it may also involve forming logical theories about the correlation of events. Examples of questions answered by diagnostic analytics include: How effective was the marketing blitz and which channel had the most impact? Did the weather affect sales or was it the price increase?
  4. Prescriptive analytics – provides insight into “what to do to make something happen”. Examples of questions answered by prescriptive analytics include: Based on the results of our test marketing blitz campaign, if we roll out the full campaign with adjustments to the channel spread, how many additional temporary customer service staff will we need to handle the increased volume without long wait times?
The four (4) types of data analytics

Descriptive analytics is the simplest and most common form of analytics used in organizations and is widely referred to as Business Intelligence (BI). There is widespread interest in predictive analytics but less than 50% of companies currently use it as it requires additional, more expensive skills. Diagnostic and prescriptive analytics have always been around because companies have always used information from descriptive analytics to hypothesize “why things happened” and make decisions on “what to do”. But it’s the automation of these types through new methods and the integration of more data inputs that is fairly new. The latter three forms are sometimes called Advanced Analytics or Data Science.

All the types of analytics will require some form of data integration and use some of the same data in an environment, but while descriptive analytics only needs data from the time periods being analyzed and usually from a narrower data set, the predictive, prescriptive and diagnostic analytics produce better results using as much data as is available from a wider timeframe and from a broader set of sources. There is overlap with the different types of analytics because the analysis of “what may happen” is driven by “what has happened” in the past and “why it happened”; and determining “what to do” will be driven by “what has happened”, “why it happened”, and “what may happen”. Companies on the forefront of data analytics will tend to use all four types.

Salesforce Einstein Bots

What is a Salesforce Einstein Bot?

According to Salesforce a bot is “a computer program which conducts a conversation via auditory or textual methods.”.

So, before we get more into what a bot is let’s first look at the platform they are created on, Salesforce’s Einstein Analytics.

Salesforce’s Einstein Analytics provides impressive mechanisms that assist organizations and their users of the Salesforce platform to connect, communicate & interpret customer needs. By implementing elements of artificial intelligence, data mining and predictive analytics Salesforce users can get deeper insights into their customers data and begin to build an improved base of knowledge related to their business. With an underlying engine tuned for performance and a presentation layer which can display key details or high level metrics on dashboards Einstein Analytics is the next step in reporting on the health of your sales pipeline, exposing opportunities and providing suggestions to help guide you in identifying & visualizing growth which aligns to your business.

Now, back to bots …

Basically, a bot is a means to facilitate communication between humans and computers with either voice or text and subsequently executing an action tied to the input provided. Bots can learn over time to interact with humans by leveraging Salesforce’s Einstein Analytics platform and your data which resides in Salesforce and respond using Natural Language Processing. According to Wikipedia, “Natural language processing (NLP) is a subfield of linguistics, computer science, information engineering, and artificial intelligence concerned with the interactions between computers and human (natural) languages, in particular how to program computers to process and analyze large amounts of natural language data.”

Why are Salesforce Einstein Bots important?

Organizations are creating and implementing bots at an ever-increasing rate. By creating and implementing a bot an organization can begin to get a handle on support cases resolving many of them very quickly and for some scenarios eliminating the need to open one at all.

Of course, a bot isn’t something that is intended to supplant interaction with a human. However, they can be leveraged to provide a decision path for customers and route customer’s requests quickly based on their general needs while providing a positive initial reception which can augment your current customer service model.

Not only can bots improve productivity of agents by freeing them from having to spend time addressing some of the simpler, frequent requests but can now allow them to focus on more time consuming, complex issues.

Bots in a sense can also be considered another channel for content. However, instead of thinking of new ways to formulate questions from scratch organizations should try to marry current content to bot questions. Reusing content is good but it should rely on content that is based on existing knowledge. This reuse of inhouse documentation & materials will ultimately bring development costs down leading toward a more uniform experience with a higher degree of excellence for the interaction.

How to configure the platform for Salesforce Einstein Bots?

Before you jump in and start creating bots you would be best served by allocating time to plan your bot and consider how it will interact with your customers.

Collaborating and soliciting feedback from agents regarding the issues they experience with customers that are potential areas a bot could address is a good start.

Think about the bot’s persona, what its name should be and how you would like it to convey & reiterate a consistent image of the company overall.

Decisions related to which channels to use, ways in which customers can enter their questions, which licenses are required, which profile to use, whether to provide a menu, what is not in scope for the bot, … etc. should all be worked out in advance of bot development.

At what point does a human need to take over from the bot’s interaction with the customer, if at all?

In Salesforce you will need a Service Cloud license and a Chat or Messaging license. Once that is obtained you will need to turn on Lightning Experience. There is a guided setup flow for Chat you will need to run through. If your organization has Knowledge articles you want to make available to customers through the bot that will need to be enabled also. In your Salesforce Org if you go to Setup and type Einstein Bots in the quick select area it will return Einstein Bots you can click on. Then under Settings there is a toggle to enable Einstein Bots.

When ready make an Embedded Chat button available on your published Salesforce site or community site for your customers to interact with. A Salesforce community site is preferred.

Check out the https://trailhead.salesforce.com/en/home free training to find out more about how to create bots within Salesforce.

Things to consider when maintaining Salesforce Einstein Bots.

Salesforce documentation indicates that the following items also be considered when planning bot creation:

  • Chat and Messaging licenses support different channels (such as SMS or Facebook Messenger) and might have different requirements.
  • Each org is provided 25 Einstein Bots conversations per month for each user with an active subscription.
  • To make full use of the Einstein Bots Performance page, obtain the Service Analytics App.

Learning Hadoop: The key features and benefits of Hadoop

What are the key features and benefits of Hadoop? Why is Hadoop such a successful platform?

Apache Hadoop, mostly called just Hadoop, is a software framework and platform for reading, processing, storing and analyzing very large amounts of data. There are several features of Hadoop that make it a very powerful solution for data analytics.

Hadoop is Distributed

With Hadoop, from a few to hundreds or thousands of commodity servers (called nodes) can be connected (forming a cluster) to work together to achieve whatever processing power and storage capability is needed. The software platform enables the nodes to work together, passing work and data between them. Data and processing is distributed across nodes which spreads the load and significantly reduces the impact of failure.

Hadoop is Scalable

In the past, to achieve extremely powerful computing, a company would have to buy very expensive, large, monolithic computers. As data growth exploded, eventually even those super computers would become insufficient. With Hadoop, from a few to hundreds or thousands or even millions of commodity servers can be relatively easily connected to work together to achieve whatever processing power and storage capability is needed. This allows a company or project to start out small and then grow as needed inexpensively, without any concern about hitting a limitation.

Hadoop is Fault Tolerant

Hadoop was designed and built around the fact that there will be frequent failures on the commodity hardware servers that make up the Hadoop cluster. When a failure occurs, the software handles the automatic reassignment of work and replication of data to other nodes in the cluster, and the system continues to function properly without manual intervention. When a node recovers, from a reboot for example, it will rejoin the cluster automatically and become available for work.

Hadoop is backed by the power of Open Source

Hadoop is open source software, which means that it can be downloaded, installed, used and even modified for free. It is managed by the renown non-profit group, Apache Software Foundation (ASF), hence the name Apache Hadoop. The group is made up of many brilliant people from all over the world, many of whom work at some of the top technology companies, who commit their time to managing the software. In addition, there are also many developers that contribute code to enhance or add new features and functionality to Hadoop or to add new tools that work with Hadoop. The various tools that have been built over the years to complement core Hadoop make up what is called the Hadoop ecosystem. With a large community of people from all over the world continuously adding to the growth of the Hadoop ecosystem in a well-managed way, it will only get better and become more useful to many more use-cases.

These are the reasons Hadoop has become such a force within the data world. Although there is some hype around the big data phenomenon, the benefits and solutions based on the Hadoop ecosystem are real.

You can learn more at https://hadoop.apache.org

Creating a Business Intelligence (BI) & Analytics Strategy and Roadmap

This post provides some of my thoughts on how to go about creating a Business Intelligence (BI) & Analytics Strategy and Roadmap for your client or company.  Please comment with your suggestions from your experience for improving this information.


When creating or updating the BI & Analytics Strategy and Roadmap for a company, one of the first things to understand is:

Who are all the critical stakeholders that need to be involved?

Understanding who needs and uses the BI & Analytics systems is critical for starting the process of understanding and documenting the “who needs what, why, and when”.

These are some of the roles that are typically important stakeholders:

  • High-level business executives that are paying for the projects
  • Business directors involved in the usage of the systems
  • IT directors involved in the developing and support of the systems
  • Business Subject Matter Experts (SME’s) & Business Analysts
  • BI/Analytics/Data/System Architects
  • BI/Analytics/Data/System Developers and Administrators


Then, you need to ask all these stakeholders, especially those from the business:

What are the drivers for BI & Analytics? And what is the level of importance for each of these drivers?

This will help you to understand and document what business needs are creating the need for new or modified BI & Analytics solutions. You should then go deeper to understand … what are the business objectives and goals that are driving these business needs.  This will help you to understand and document the bigger picture so that a more comprehensive strategy and roadmap can be created.

The questions and discussions surrounding the above will require deep and broad business involvement. Getting the perspective of a wide range of users from all business areas that are using the BI & Analytics Systems is critical.  The business should be involved throughout the process of creating the strategy and roadmap, and all decisions should tie back to support for business objectives and goals. And the trail leading to all these decisions must be documented.

Some examples of business drivers include:

  • Gain more insight into who our best customers are and how best to acquire them.
  • Understand how weather affects our sales/revenue.
  • Determine how we can sell more to our existing customers.
  • Understand what causes employee turnover.
  • Gain insight into how we can improve staffing schedules.


And examples of business objectives and goals may include things like:

  • Increase corporate revenues by 10%
  • Grow our base of recurring customers
  • Stabilize corporate revenues over all seasons
  • Create an environment where employees love to work
  • Reduce payroll costs without a reduction in staff, for example, reduce turnover.


Then, turn to understanding and documenting the current scenario (if not already known). Identify what systems (including data sources) are in place, who are using them (and why and how), what capabilities do they offer, what are the must-haves, and what are the pain points and positive highlights.

Also, you will need to determine the current workload (and future workload if it can be determined) of the primary team members involved in developing, testing, and implementing BI & Analytics solutions.

This will help you understand a few things:

  • Some of the highest priority needs of the users
  • Gaps in capabilities and data between what is needed and what is currently in place (including an understanding of what is liked and disliked about the current systems)
  • Current user base knowledge and engagement
  • IT knowledge and skills
  • Resource availability – when are people available to work on new initiatives


What are the options and limitations?

  • Can existing systems be customized to meet the requirements?
  • Can they be upgraded to a new version that has the needed functionality?
  • Do we need to consider adding a new platform or replacing one or more of the existing systems with a new platform?
  • Can we migrate from/integrate one system to/with another system that we already have up and running?
  • Are any of our current systems losing vendor support or require an upgrade for other reasons? Has the pricing changed for any of our software applications?
  • What options does our budget permit us to explore?
  • What options do our knowledge and skills permit us to explore?


Once you have identified these items …

  • Identify and engage stakeholders, and document these roles and the people
  • Identify and document business drivers, objectives and goals
  • Understand and document the current landscape – needs (including must-haves), technology, gaps, users, IT staff, resource availability, and more
  • Identify and document options – based on current landscape, technology, budget, staff resources, etc.

… you can develop a “living” Strategy and Roadmap for BI & Analytics. And when I say “living”, I mean it will not be a static document, but will be fine-tuned over time as new information emerge and as changes arise in business needs, technology, and staff resources.


Your Strategy and Roadmap for BI & Analytics should include, but is not limited to:

  • BI & Analytics that will be used to satisfy business drivers, objectives and goals
  • Data acquisition and storage plan for meeting the analytics needs
  • Technology platforms that will be used to process and store data, and deliver the analytics
  • Information about any new technologies that needs to be acquired or implemented, and schedules
  • Roles and Responsibilities for all stakeholders involved in BI & Analytics projects
  • Planned staffing allocations and schedules
  • Planned staffing changes and schedules
  • User training (business users) and Delivery team training (technical implementers & developers for example)
  • List dependencies for each item or set of items