Tag: Power BI

Why can’t I add search to my Power BI slicer?

Power BI makes it really easy to add the search capability to slicers to allow users to search for values. This is especially useful when there are many values available in the slicer. However, you might be wondering, “Why don’t I see the Search option on my slicer?” or ‘How can I add the Search option to my slicer since it’s not showing in the options?”

Unfortunately, this feature is not available on numeric or date slicers.

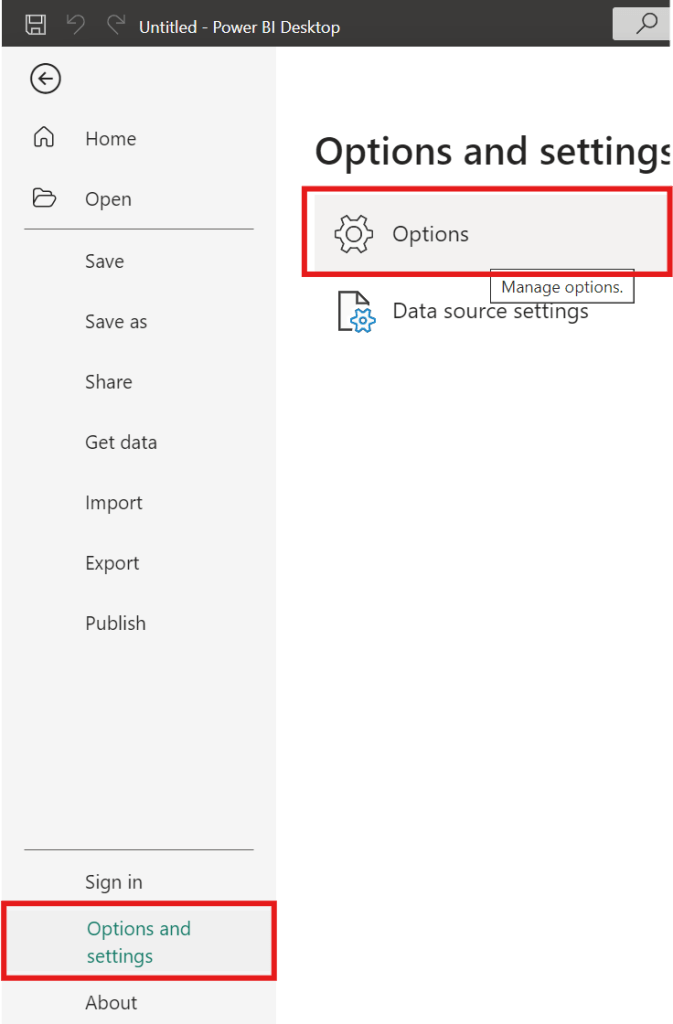
To access and activate (or deactivate) the search feature on a slicer, hover over the slicer, and then click the “3-dots” icon in the top right.

If the slicer contains text values, you will see the following options, from which you can simply click “Search” to activate the feature:

When it is “checked” as shown above, it’s activated, and it’s deactivated when not “checked”.

However, if the slicer contains date or number values, you will see the following options, which do not include the “Search” option:

A very ugly option is to set your slicer settings Style to “Between”, and then a user would be able to enter the same value in both the From and To values to find the specific value. Obviously, this is not ideal and will not be desirable in most cases, but it is an option for some cases, and maybe useful during testing.

Good luck on your data journey!

Errors loading data from Excel into Power BI

While loading some data from several Excel files into Power BI, I encountered the following errors:

Table1:
“Load was cancelled by an error in loading a previous table.”

Table2:
“OLE DB or ODBC error: [Expression.Error] The key didn’t match any rows in the table.”

Table3:
“A single value for column ‘Area of Responsibility’ in table ‘Requisitions-Load’ cannot be determined. This can happen when a measure formula refers to a column that contains many values without specifying an aggregation such as min, max, count, or sum to get a single result.”

As you know (since you are reading this post), these error messages are not very specific.  I did not immediately find anything obviously wrong.  After reading a couple posts, I checked the latest data files to see if there were any new, missing, or incorrect column names or sheet names.

Turns out, one of the files did not have the expected Sheet name. After updating the sheet name to the correct name, all the files loaded without an issue.

I hope this helped.

Activating or Deactivating “Preview Features” in Power BI

Microsoft frequently adds new features that are available for preview in Power BI. This is a way for Microsoft to launch the features and have them tested by the community before making them fully available in the Power BI application. These features are sometimes in preview mode for a long time, and you may find that you want to use one or more of these features before they become generally available.

To activate (or deactivate) preview features, go to … File –> Options and settings –> Options

Then, in the Options window, select “Preview features” (on the left) as shown below.

Then, select the options you would like to activate or deactivate on the right side, such as checking “Shape map visual” to activate it or unchecking “Sparklines” to deactivate it. Once you have selected or unselected all the features you want, then click “OK”. Then, make sure to save whatever you need to, and then close and reopen Power BI for the activations or deactivations to take effect.

Thanks for reading.

Add a “Last Refreshed Date” notification on a Power BI dashboard

It is customary to add a “Last Refreshed Date” to dashboards to notify users of when the dashboard was last refreshed. Here will go through the steps of adding a “Last Refreshed Date” to a Power BI dashboard.

Open the dashboard you want to add the notification to in Power BI Desktop, and then Get Date -> Blank Query. Name the new query as “Last Refreshed Date” or something like that.

Then, set the value as shown below, by typing “= DateTime.LocalNow()” into the formula area:

Next, convert the value to a Table by clicking the “To Table” icon, and then clicking the “To table” option:

A table with the single date column is created

Set the data type as Date/Time …

… and rename the column to something meaningful, such as “Last Refreshed Date” …

Close and apply your changes.

The table will be added to your Power BI model. It should have no relationships.

Now, add a Card visual to your dashboard, place it where it is visible but out of the way, such as in the top-right or bottom-right corner, and add the Last Refreshed Date column to it from the new table. Now, whenever your dashboard is refreshed, this new table and visual will also be updated/refreshed.

Thanks for reading!

Transpose vs. Pivot vs. Unpivot in Power BI

In this post, I will quickly show how to perform 3 key transformations in Power BI – Transpose, Pivot, and Unpivot – and what impact they have on the data they are applied to. These transformations are often needed to manipulate the original data to get it into the shape needed to create the Power BI model and reports. We will use a simple example so that you can see clearly the effect of each transformation.

This is the original dataset – Student Grades:

Transpose

Transpose the data by going to the Transform ribbon and clicking “Transpose”.

This is what the data looks like after the Transpose transformation is applied. The rows are converted into columns, and the columns are converted into rows. Default headers / column names are applied.

Pivot Column

Starting with the original dataset, we will now Pivot the dataset. Go to Transform ribbon, click on “Pivot Column”.

The Pivot Column dialog opens. As noted, it will use the values in the Names column to create new columns, and will use the Score column as the Values Column.

This is what the data looks like after Pivot is applied as described above. Pivot Column converts the selected Name column values into column headers.

Unpivot Columns

Starting with the original dataset, we will now Unpivot the dataset. First select all 4 name columns by using “Ctrl + Click”.

Then, go to Transform ribbon, click on “Unpivot Columns”. This is what the data looks like after the Unpivot Columns transformation is applied. Unpivot Columns converts the selected columns (the name columns in this case) into a column of values (Attribute) and the column values are stored in the Value column.

Thanks for reading!

How to reopen the Query Settings pane that has the APPLIED STEPS in Power BI Power Query

If you have closed the Query Settings pane (the pane that has the APPLIED STEPS) in Power Query of Power BI and need to bring it back (reopen it), go to the View ribbon, and click the “Query Settings” icon.

The Query Settings pane which shows all the APPLIED STEPS (transformations) that have been applied to the data brought into the Power BI application will open at the right of the screen (where it normally resides).

Thanks for reading!

Setting a table as a date table in Power BI to be able to use the delivered Time Intelligence functions

It is common to have the need to perform time-driven analysis on your data. For example, you may need to compare this month’s sales with the sales from the same period a year ago or you may need to calculate the number of days between two dates. Power BI provides a set of Time Intelligence functions that make it easy to perform these types of calculations. But to take advantage of the Time Intelligence functions in Power BI, you must have a date table in your Power BI model and to have that you will need to “mark” a table as a date table.

To mark a table as a date table, it must meet the following criteria:

  • It must have a column of data type “Date” or “Date/time”. This will be referred to as the “date column”.
  • The date column must contain unique date values. For example, you cannot have the value “3/1/2022” (or any other date value) listed twice (or more than once) in the table.
  • The date column must not contain BLANKs or NULLs. Only unique date values should be in the table’s date column.
  • The date column must not have any missing dates or gaps in dates. For example, you cannot have 1/1/2022 and then 1/3/2022 and not have 1/2/2022 in the date values.
  • The date column must span full years. Keep in mind that a year isn’t necessarily a calendar year (January-December), but should cover the entire 12 months, such as all dates between July 1, 2022 – June 30, 2023, inclusive. If you have less than one year’s dates in your table, then the range can be less than a year, but there cannot be any gaps. Also,

Once these rules are met, you can then mark the table as the date table. To do this, you can either right-click on the table in the Data pane and select “Mark as date table” (as shown below):

Or with the table selected in the Data pane, from the Table Tools tab, click on the “Mark as date table” icon. This icon will be grayed out if there are no date columns in the table.

The “Mark as date table” dialog opens (which includes a warning), from which you can turn on the “Mark as date table” flag.

Turn on the flag, and then select / set the date column from the dropdown.

Power BI will then validate your data to make sure all the criteria is met for the chosen column. If you get an error, make the necessary changes and try again.

Thanks for reading!

How to create an Index column or ID column in Power BI

When working with data, you may need to add an index column (or an ID column) to your data. For example, you may have a list of products (names and descriptions) but you do not have an ID for each product, and you need to assign one to each product, perhaps for data modeling purposes.

To add an index or ID column to each row, you will do this in the Power Query Editor. With your query (table) open, go to the “Add Column” tab where you will see the “Index Column” option. 

You can click the menu item to use its default option – which will add an index column that starts at zero (0) – as shown below.

Or you may click the dropdown (to the right of the Index Column menu item) to choose from 3 available options (From 0, From 1, or Custom).

“From 0” will add an index column that starts at zero (0) as shown above (in the default example).

“From 1” will add an index column that starts at one (1), as shown below:

“Custom” will open a dialog for you to enter the “Starting index” value and the “Increment” between each value. In the example below, the starting index value is set to 1000, and the increment is set to 5.

This means that the first value in the index column will be 1000, the second value will be 1005, the third 1010, and so on. This is shown below.

Once your index column is added, you can rename it and move it as desired. For example, you may rename the column name to Product ID and move the column to the front of the table as shown below.

Thanks for reading. I hope you found this useful.

How to enter data manually (and update it) in Power BI

Enter Data

Whether you need to create a small lookup table or you need data in a small table to test an idea or feature, you may have the need to manually or directly enter data into a table in Power BI. To do this you will use the “Enter Data” feature available in the “Home” tab/ribbon in the Power Query Editor.

Click the “Enter Data” ribbon icon. It will open the “Create Table” window (dialog) – shown below.

Enter the desired data, including the column names for as many columns as you need, and the values for as many rows as you need. However, typically this feature is used for small table (few columns and few rows). It is best to have larger data tables in a database or file. In the example below, 3 columns and 5 rows of office location information were entered.

Also, name the table appropriately. The table is named “Location” in the example above.

Once you are done entering the data and naming your table, click OK. The table will be added as a query. You can now use this table/query just like any other query in Power Query.

Update Data

After you have created the new query, how do you update the data? Whether you need to make a correction or an update to existing data or add new data, select the query, then in the “APPLIED STEPS” pane to the right, click on the gear icon in the “Source” step.

This will reopen the “Create Table” window from where you can add, delete, and update any of the records.

Thanks for reading.

How to sort a column by another column in Power BI

Power BI allows you to sort one column, such as a column displayed in a visual, by another, such as one that is not displayed. Here we will explain how this is done.

A very common case of this is with “Month Name”. You typically want to display the Month Name (Jan or January, …, Dec or December, etc.) and not the Month Number (1, 2, …, 12). And instead of sorting the month name alphabetically (Apr, Aug, Dec, …, Sep), typically you want to sort it chronologically (Jan, Feb, Mar, …, Dec).

In this made-for-example scenario, you have Sales by Month, and when you sort by Month, it is displayed as shown below – as expected in alphabetical month order.

But as mentioned before, we really want the months sorted in chronological order. To do this, we need to sort the Month Name by the Month Number.

Click the “Month” field (month name) in the Data pane, and then click the “Sort by column” icon dropdown, and select “Month No” (month number). This is telling Power BI to sort the month (Month) by the month number (Month No), instead of the month name (Month).

So, now your Sales by Month visual with the same sorting will look like the below – sorted by month chronologically.

Thanks for reading!