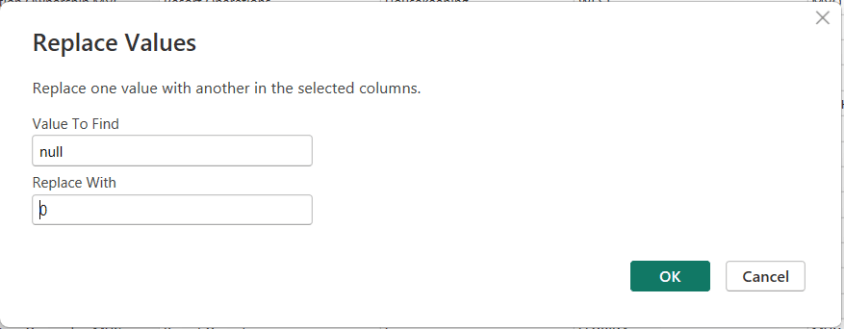
In Power BI, handling NULL values is a common data-preparation step to get your data ready for analysis, and Power Query makes this easy using the Replace Values feature.
This option is available from both the Home menu …
… and the Transform menu in the Power Query Editor.
To replace NULLs, first select the column where the NULL values exist. Then choose Replace Values. When the dialog box appears, enter null as the value to find and replace, and specify the value you want to use instead—such as 0 for numeric columns or “Unknown” for text columns.
After confirming, Power Query automatically updates the column and records the step.
One of the more confusing Power BI errors—especially for intermediate users—is:
“A circular dependency was detected”
This error typically appears when working with DAX measures, calculated columns, calculated tables, relationships, or Power Query transformations. While the message is short, the underlying causes can vary, and resolving it requires understanding how Power BI evaluates dependencies.
This article explains what the error means, common scenarios that cause it, and how to resolve each case.
What Does “Circular Dependency” Mean?
A circular dependency occurs when Power BI cannot determine the correct calculation order because:
Object A depends on B
Object B depends on A (directly or indirectly)
In other words, Power BI is stuck in a loop and cannot decide which calculation should be evaluated first.
Power BI uses a dependency graph behind the scenes to determine evaluation order. When that graph forms a cycle, this error is triggered.
Example of the Error Message
Below is what the error typically looks like in Power BI Desktop:
A circular dependency was detected:
Table[Calculated Column] → Measure[Total Sales] → Table[Calculated Column]
Power BI may list:
Calculated columns
Measures
Tables
Relationships involved in the loop
⚠️ The exact wording varies depending on whether the issue is in DAX, relationships, or Power Query.
Common Scenarios That Cause Circular Dependency Errors
1. Calculated Column Referencing a Measure That Uses the Same Column
Scenario
A calculated column references a measure
That measure aggregates or filters the same table containing the calculated column
Example
-- Calculated Column
Flag =
IF ( [Total Sales] > 1000, "High", "Low" )

-- Measure
Total Sales =
SUM ( Sales[SalesAmount] )
Why This Fails
Calculated columns are evaluated row by row during data refresh
Measures are evaluated at query time
The measure depends on the column, and the column depends on the measure → loop
How to Fix
✅ Replace the measure with row-level logic
Flag =
IF ( Sales[SalesAmount] > 1000, "High", "Low" )
✅ Or convert the calculated column into a measure if aggregation is needed
2. Measures That Indirectly Reference Each Other
Scenario
Two or more measures reference each other through intermediate measures.
Example
Measure A = [Measure B] + 10
Measure B = [Measure A] * 2
Why This Fails
Power BI cannot determine which measure to evaluate first
How to Fix
✅ Redesign logic so one measure is foundational
Base calculations on columns or constants
Avoid bi-directional measure dependencies
Best Practice
Create base measures (e.g., Total Sales, Total Cost)
Build higher-level measures on top of them
3. Calculated Tables Referencing Themselves (Directly or Indirectly)
The CALCULATE function is often described as the most important function in DAX. It is also one of the most misunderstood. While many DAX functions return values, CALCULATE fundamentally changes how a calculation is evaluated by modifying the filter context.
If you understand CALCULATE, you unlock the ability to write powerful, flexible, and business-ready measures in Power BI.
This article explores when to use CALCULATE, how it works, and real-world use cases with varying levels of complexity.
What Is CALCULATE?
At its core, CALCULATE:
Evaluates an expression under a modified filter context
High Value Sales :=
CALCULATE (
    [Total Sales],
    FILTER (
        Sales,
        Sales[SalesAmount] > 1000
    )
)
This pattern is common for:
Exception reporting
Threshold-based KPIs
Business rules
Performance Considerations
Prefer Boolean filters over FILTER when possible
Avoid unnecessary CALCULATE nesting
Be cautious with ALL ( Table ) on large tables
Use measures, not calculated columns, when possible
Common Mistakes with CALCULATE
Using it when it’s not needed
Expecting filters to be additive (they usually replace)
Overusing FILTER instead of Boolean filters
Misunderstanding row context vs filter context
Nesting CALCULATE unnecessarily
Where to Learn More About CALCULATE
If you want to go deeper (and you should), these are excellent resources:
Official Documentation
Microsoft Learn – CALCULATE
DAX Reference on Microsoft Learn
Books
The Definitive Guide to DAX — Marco Russo & Alberto Ferrari
Analyzing Data with Power BI and Power Pivot for Excel
Websites & Blogs
SQLBI.com (arguably the best DAX resource available)
Microsoft Power BI Blog
Video Content
SQLBI YouTube Channel
Microsoft Learn video modules
Power BI community sessions
Final Thoughts
CALCULATE is not just a function — it is the engine of DAX. Once you understand how it manipulates filter context, DAX stops feeling mysterious and starts feeling predictable.
Mastering CALCULATE is one of the biggest steps you can take toward writing clear, efficient, and business-ready Power BI measures.
Artificial Intelligence is shaping nearly every industry, but breaking into AI right out of college can feel overwhelming. The good news is that you don’t need a PhD or years of experience to start a successful AI-related career. Many AI roles are designed specifically for early-career talent, blending technical skills with problem-solving, communication, and business understanding.
This article outlines excellent AI career options for people just entering the workforce, explaining what each role involves, why it’s a strong choice, and how to prepare with the right skills, tools, and learning resources.
1. AI / Machine Learning Engineer (Junior)
What It Is & What It Involves
Machine Learning Engineers build, train, test, and deploy machine learning models. Junior roles typically focus on:
Implementing existing models
Cleaning and preparing data
Running experiments
Supporting senior engineers
Why It’s a Good Option
High demand and strong salary growth
Clear career progression
Central role in AI development
Skills & Preparation Needed
Technical Skills
Python
SQL
Basic statistics & linear algebra
Machine learning fundamentals
Libraries: scikit-learn, TensorFlow, PyTorch
Where to Learn
Coursera (Andrew Ng ML specialization)
Fast.ai
Kaggle projects
University CS or data science coursework
Difficulty Level: ⭐⭐⭐⭐ (Moderate–High)
2. Data Analyst (AI-Enabled)
What It Is & What It Involves
Data Analysts use AI tools to analyze data, generate insights, and support decision-making. Tasks often include:
Data cleaning and visualization
Dashboard creation
Using AI tools to speed up analysis
Communicating insights to stakeholders
Why It’s a Good Option
Very accessible for new graduates
Excellent entry point into AI
Builds strong business and technical foundations
Skills & Preparation Needed
Technical Skills
SQL
Excel
Python (optional but helpful)
Power BI / Tableau
AI tools (ChatGPT, Copilot, AutoML)
Where to Learn
Microsoft Learn
Google Data Analytics Certificate
Kaggle datasets
Internships and entry-level analyst roles
Difficulty Level: ⭐⭐ (Low–Moderate)
3. Prompt Engineer / AI Specialist (Entry Level)
What It Is & What It Involves
Prompt Engineers design, test, and optimize instructions for AI systems to get reliable and accurate outputs. Entry-level roles focus on:
Writing prompts
Testing AI behavior
Improving outputs for business use cases
Supporting AI adoption across teams
Why It’s a Good Option
Low technical barrier
High demand across industries
Great for strong communicators and problem-solvers
Skills & Preparation Needed
Key Skills
Clear writing and communication
Understanding how LLMs work
Logical thinking
Domain knowledge (marketing, analytics, HR, etc.)
Where to Learn
OpenAI documentation
Prompt engineering guides
Hands-on practice with ChatGPT, Claude, Gemini
Real-world experimentation
Difficulty Level: ⭐⭐ (Low–Moderate)
4. AI Product Analyst / Associate Product Manager
What It Is & What It Involves
This role sits between business, engineering, and AI teams. Responsibilities include:
Defining AI features
Translating business needs into AI solutions
Analyzing product performance
Working with data and AI engineers
Why It’s a Good Option
Strong career growth
Less coding than engineering roles
Excellent mix of strategy and technology
Skills & Preparation Needed
Key Skills
Basic AI/ML concepts
Data analysis
Product thinking
Communication and stakeholder management
Where to Learn
Product management bootcamps
AI fundamentals courses
Internships or associate PM roles
Case studies and product simulations
Difficulty Level: ⭐⭐⭐ (Moderate)
5. AI Research Assistant / Junior Data Scientist
What It Is & What It Involves
These roles support AI research and experimentation, often in academic, healthcare, or enterprise environments. Tasks include:
Running experiments
Analyzing model performance
Data exploration
Writing reports and documentation
Why It’s a Good Option
Strong foundation for advanced AI careers
Exposure to real-world research
Great for analytical thinkers
Skills & Preparation Needed
Technical Skills
Python or R
Statistics and probability
Data visualization
ML basics
Where to Learn
University coursework
Research internships
Kaggle competitions
Online ML/statistics courses
Difficulty Level: ⭐⭐⭐⭐ (Moderate–High)
6. AI Operations (AIOps) / ML Operations (MLOps) Associate
What It Is & What It Involves
AIOps/MLOps professionals help deploy, monitor, and maintain AI systems. Entry-level work includes:
Model monitoring
Data pipeline support
Automation
Documentation
Why It’s a Good Option
Growing demand as AI systems scale
Strong alignment with data engineering
Less math-heavy than research roles
Skills & Preparation Needed
Technical Skills
Python
SQL
Cloud basics (Azure, AWS, GCP)
CI/CD concepts
ML lifecycle understanding
Where to Learn
Cloud provider learning paths
MLOps tutorials
GitHub projects
Entry-level data engineering roles
Difficulty Level: ⭐⭐⭐ (Moderate)
7. AI Consultant / AI Business Analyst (Entry Level)
What It Is & What It Involves
AI consultants help organizations understand and implement AI solutions. Entry-level roles focus on:
Use-case analysis
AI tool evaluation
Process improvement
Client communication
Why It’s a Good Option
Exposure to multiple industries
Strong soft-skill development
Fast career progression
Skills & Preparation Needed
Key Skills
Business analysis
AI fundamentals
Presentation and communication
Problem-solving
Where to Learn
Business analytics programs
AI fundamentals courses
Consulting internships
Case study practice
Difficulty Level: ⭐⭐⭐ (Moderate)
8. AI Content & Automation Specialist
What It Is & What It Involves
This role focuses on using AI to automate content, workflows, and internal processes. Tasks include:
Building automations
Creating AI-generated content
Managing tools like Zapier, Notion AI, Copilot
Why It’s a Good Option
Very accessible for non-technical graduates
High demand in marketing and operations
Rapid skill acquisition
Skills & Preparation Needed
Key Skills
Workflow automation
AI tools usage
Creativity and organization
Basic scripting (optional)
Where to Learn
Zapier and Make tutorials
Hands-on projects
YouTube and online courses
Real business use cases
Difficulty Level: ⭐⭐ (Low–Moderate)
How New Graduates Should Prepare for AI Careers
1. Build Foundations
Python or SQL
Data literacy
AI concepts (not just tools)
2. Practice with Real Projects
Personal projects
Internships
Freelance or volunteer work
Kaggle or GitHub portfolios
3. Learn AI Tools Early
ChatGPT, Copilot, Gemini
AutoML platforms
Visualization and automation tools
4. Focus on Communication
AI careers, and careers in general, reward those who can explain complex ideas simply.
Final Thoughts
AI careers are no longer limited to researchers or elite engineers. For early-career professionals, the best path is often a hybrid role that combines AI tools, data, and business understanding. Starting in these roles builds confidence, experience, and optionality—allowing you to grow into more specialized AI positions over time. And the advice that many professionals give for gaining knowledge and breaking into the space is to “get your hands dirty”.
The GENERATE / ROW pattern is an advanced but powerful DAX technique used to dynamically create rows and expand tables based on calculations. It is especially useful when you need to produce derived rows, combinations, or scenario-based expansions that don’t exist physically in your data model.
This article explains what the pattern is, when to use it, how it works, and provides practical examples. It assumes you are familiar with concepts such as row context, filter context, and iterators.
What Is the GENERATE / ROW Pattern?
At its core, the pattern combines two DAX functions:
GENERATE() – Iterates over a table and returns a union of tables generated for each row.
ROW() – Creates a single-row table with named columns and expressions.
Together, they allow you to:
Loop over an outer table
Generate one or more rows per input row
Shape those rows using calculated expressions
In effect, this pattern mimics a nested loop or table expansion operation.
Why This Pattern Exists
DAX does not support procedural loops like for or while. Instead, iteration happens through table functions.
GENERATE() fills a critical gap by allowing you to:
Produce variable numbers of rows per input row
Apply row-level calculations while preserving relationships and context
Function Overview
GENERATE
GENERATE (
    table1,
    table2
)
table1: The outer table being iterated.
table2: A table expression evaluated for each row of table1.
The result is a flattened table containing all rows returned by table2 for every row in table1.
This is especially useful for timeline visuals or event-based reporting.
Performance Considerations ⚠️
The GENERATE / ROW pattern can be computationally expensive.
Best Practices
Filter the outer table as early as possible
Avoid using it on very large fact tables
Prefer calculated tables over measures when expanding rows
Test with realistic data volumes
Common Mistakes
❌ Using GENERATE When ADDCOLUMNS Is Enough
If you’re only adding columns—not rows—ADDCOLUMNS() is simpler and faster.
❌ Forgetting Table Shape Consistency
All ROW() expressions combined with UNION() must return the same column structure.
❌ Overusing It in Measures
This pattern is usually better suited for calculated tables, not measures.
Mental Model to Remember
Think of the GENERATE / ROW pattern as:
“For each row in this table, generate one or more calculated rows and stack them together.”
If that sentence describes your problem, this pattern is likely the right tool.
Final Thoughts
The GENERATE / ROW pattern is one of those DAX techniques that feels complex at first—but once understood, it unlocks entire classes of modeling and analytical solutions that are otherwise impossible.
Used thoughtfully, it can replace convoluted workarounds, reduce model complexity, and enable powerful scenario-based reporting.
Data Analysis Expressions (DAX) is a formula language used to create dynamic calculations in Power BI semantic models. Unlike SQL or KQL, DAX works within the analytical model and is designed for filter context–aware calculations, interactive reporting, and business logic. For DP-600, you should understand how to use DAX to select, filter, and aggregate data within a semantic model for analytics and reporting.
What Is DAX?
DAX is similar to Excel formulas but optimized for relational, in-memory analytics. It is used in:
DAX operates based on filter context and evaluates measures dynamically.
There is no explicit SELECT statement — rather, measures compute values based on current context.
Use CALCULATE to change filter context.
Aggregation functions (e.g., SUM, COUNT, AVERAGE) are fundamental to summarizing data.
Filtering functions like FILTER and time intelligence functions enhance analytical flexibility.
Final Exam Tips
If a question mentions interactive reports, dynamic filters, slicers, or time-based comparisons, DAX is likely the right language to use for the solution.
If the question mentions slicers, visuals, or dynamic results, think DAX measure.
Time intelligence functions are high-value topics.
Practice Questions:
Here are 10 questions to test and help solidify your learning and knowledge. As you review these and other questions in your preparation, make sure to …
Identifying and understand why an option is correct (or incorrect) — not just which one
Look for and understand the usage scenario of keywords in exam questions to guide you
Expect scenario-based questions rather than direct definitions
1. Which DAX function is primarily used to modify the filter context of a calculation?
A. FILTER B. SUMX C. CALCULATE D. ALL
Correct answer: ✅ C Explanation:CALCULATE changes the filter context under which an expression is evaluated.
2. A Power BI report contains slicers for Year and Product. A measure returns different results as slicers change. What concept explains this behavior?
A. Row context B. Filter context C. Evaluation context D. Query context
Correct answer: ✅ B Explanation: Filter context is affected by slicers, filters, and visual interactions.
3. Which DAX function iterates row by row over a table to perform a calculation?
A. SUM B. COUNT C. AVERAGE D. SUMX
Correct answer: ✅ D Explanation:SUMX evaluates an expression for each row and then aggregates the results.
4. You want to calculate total sales only for transactions greater than $1,000. Which approach is correct?
8. Which DAX function returns a table instead of a scalar value?
A. SUM B. AVERAGE C. FILTER D. COUNT
Correct answer: ✅ C Explanation:FILTER returns a table that can be consumed by other functions like CALCULATE.
9. Which scenario is the best use case for DAX instead of SQL or KQL?
A. Cleaning raw data before ingestion B. Transforming streaming event data C. Creating interactive report-level calculations D. Querying flat files in a lakehouse
Correct answer: ✅ C Explanation: DAX excels at dynamic, interactive calculations in semantic models.
10. What is the primary purpose of the SAMEPERIODLASTYEAR function?
A. Aggregate values by fiscal year B. Remove filters from a date column C. Compare values to the previous year D. Calculate rolling averages
Correct answer: ✅ C Explanation: It shifts the date context back one year for year-over-year analysis.
When building measures in Power BI using DAX, two commonly used aggregation functions are COUNT and COUNTA. While they sound similar, they serve different purposes and choosing the right one can prevent inaccurate results in your reports.
COUNT: Counting Numeric Values Only
The COUNT function counts the number of non-blank numeric values in a column.
DAX syntax:
COUNT ( Table[Column] )
Key characteristics of COUNT”:
Works only on numeric columns
Ignores blanks
Ignores text values entirely
When to use COUNT:
You want to count numeric entries such as:
Number of transactions
Number of invoices
Number of scores, quantities, or measurements
The column is guaranteed to contain numeric data
Example: If Sales[OrderAmount] contains numbers and blanks, COUNT(Sales[OrderAmount]) returns the number of rows with a valid numeric amount.
COUNTA: Counting Any Non-Blank Values
The COUNTA function counts the number of non-blank values of any data type, including text, numbers, dates, and Boolean values.
DAX syntax:
COUNTA ( Table[Column] )
Key characteristics of “COUNTA”:
Works on any column type
Counts text, numbers, dates, and TRUE/FALSE
Ignores blanks only
When to use COUNTA:
You want to count:
Rows where a column has any value
Text-based identifiers (e.g., Order IDs, Customer Names)
Dates or status fields
You are effectively counting populated rows
Example: If Customers[CustomerName] is a text column, COUNTA(Customers[CustomerName]) returns the number of customers with a non-blank name.
COUNT vs. COUNTA: Quick Comparison
Function
Counts
Ignores
Typical Use Case
COUNT
Numeric values only
Blanks and text
Counting numeric facts
COUNTA
Any non-blank value
Blanks only
Counting populated rows
Common Pitfall to Avoid
Using COUNTA on a numeric column can produce misleading results if the column contains zeros or unexpected values. Remember:
Zero (0) is counted by both COUNT and COUNTA
Blank is counted by neither
If you are specifically interested in numeric measurements, COUNT is usually the safer and clearer choice.
In Summary
Use COUNT when the column represents numeric data and you want to count valid numbers.
Use COUNTA when you want to count rows where something exists, regardless of data type.
Understanding this distinction ensures your DAX measures remain accurate, meaningful, and easy to interpret.
Excel Power Query is a powerful, no-code/low-code tool that allows you to combine and transform data from multiple sources in a repeatable and refreshable way. One common use case is merging two Excel files or worksheets based on multiple matching columns, similar to a SQL join. Power Query is a major part of Power BI, but it can be used in Excel.
When to Use Power Query for Merging
Power Query is ideal when:
You receive recurring Excel files with the same structure
You need a reliable, refreshable merge process
You want to avoid complex formulas like VLOOKUP or XLOOKUP across many columns
Step-by-Step Overview
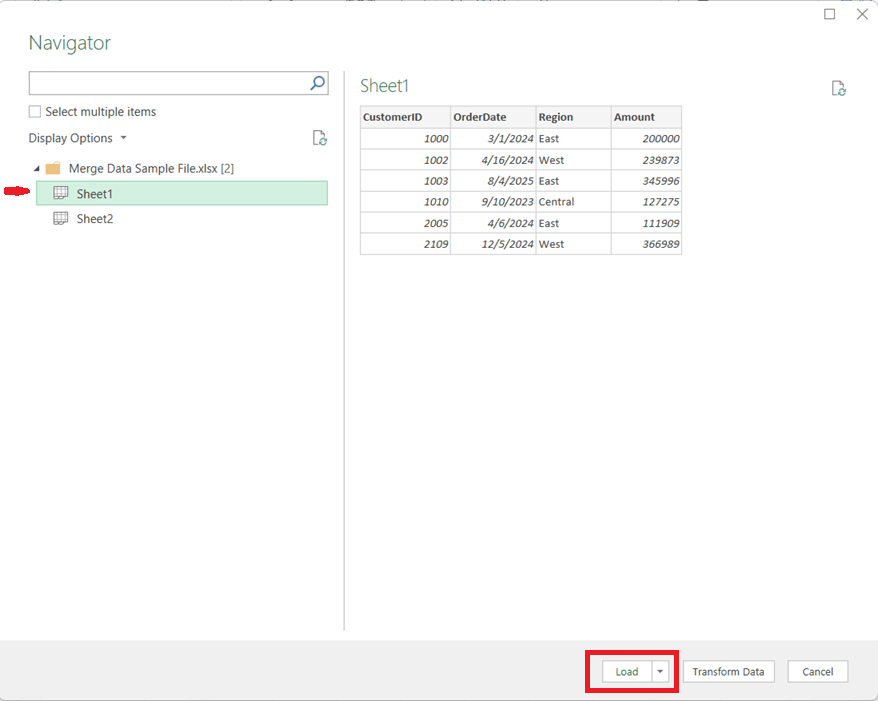
1. Load Both Data Sources into Power Query
Open Excel and go to Data → Get Data
Choose From Workbook (for separate files) or From Table/Range (for sheets in the same file)
Tip: Ensure the columns you plan to merge on have the same data types (e.g., text vs. number).
Load each dataset into Power Query as a separate query
2. Start the Merge Operation
In Power Query, select the primary table
Go to Query → Merge Queries
Choose the secondary table from the dropdown
3. Select Multiple Matching Columns
Click the first matching column in the primary table
Hold Ctrl (or Cmd on Mac) and select additional matching columns
Repeat the same column selections in the secondary table, in the same order
For example, if you needed to perform the merge on CustomerID, OrderDate, and Region, you would click Customer ID, then hold the Ctrl key and click OrderDate, then (while still holding down the Ctrl key) click Region.
Power Query treats this as a composite key, and all selected columns must match for rows from both tables to merge.
4. Choose the Join Type
Select the appropriate join kind:
Left Outer – Keep all rows from the first table (most common) and brings in the values for the matching rows from the second table
Inner – Keep only matching rows from both tables
Full Outer – Keep all rows from both tables, merging the table where there is a match and having just the values from the respective tables when there is no match
Click OK to complete the merge.
5. Expand the Merged Data
A new column appears containing nested tables
Click the expand icon to select which columns to bring in
Remove unnecessary columns to keep the dataset clean
6. Load and Refresh
Click Close & Load
The merged dataset is now available in Excel
When source files change, simply click Refresh to update everything automatically
Key Benefits
Handles multi-column joins cleanly and reliably
Eliminates fragile lookup formulas
Fully refreshable and auditable
Scales well as data volume grows
In Summary
Using Power Query to merge Excel data on multiple columns brings database-style joins into Excel, making your workflows more robust, maintainable, and professional. Once set up, it saves time and reduces errors—especially for recurring reporting and analytics tasks.
The location of your source files has changed, and now you need to update your Power BI report to use the new location. To update the directory or location of your source file, in Power BI Desktop, click Transform Data -> Data Source Settings
Then click on the entry that corresponds to the path you need to update.
Update or entirely change the path and click ok. Apply your changes.
It becomes a little more complicated when you are changing a local folder to a SharePoint location, which we will cover in another post, but for changing location of single files, it’s that simple.
You may run into this error when loading Power BI:
"load was cancelled by error in loading a previous table"
If you do get this error, keep scrolling down to see what the “inducing” error is. This message is an indication that there was an error previous to getting to the current table in the process. The real, initial error will be more descriptive. Start with resolving that error(s), and then this one will go away.
I hope you found this helpful.
Information and resources for the data professionals' community