Tag: Power BI Time Intelligence

Implement Time Intelligence Measures (PL-300 Exam Prep)

This post is a part of the PL-300: Microsoft Power BI Data Analyst Exam Prep Hub; and this topic falls under these sections:
Model the data (25–30%)
--> Create model calculations by using DAX
--> Implement Time Intelligence Measures


Note that there are 10 practice questions (with answers and explanations) at the end of each topic. Also, there are 2 practice tests with 60 questions each available on the hub below all the exam topics.

Exam Context

Time intelligence is a core DAX competency on the PL-300 exam. Microsoft frequently tests a candidate’s ability to calculate values across time, such as year-to-date, prior period comparisons, rolling totals, and growth metrics.


What Are Time Intelligence Measures?

Time intelligence measures are DAX calculations that:

  • Analyze data over time
  • Compare values across different periods
  • Accumulate results over a date range

These measures rely on:

  • A proper date table
  • Correct relationships
  • The CALCULATE function

Prerequisites for Time Intelligence (Frequently Tested)

Before time intelligence will work correctly, the model must include:

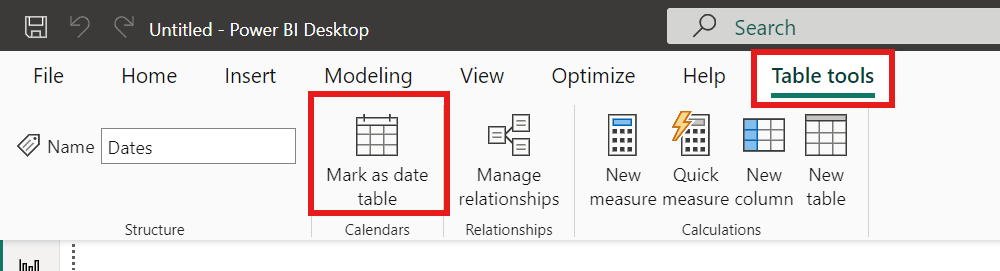
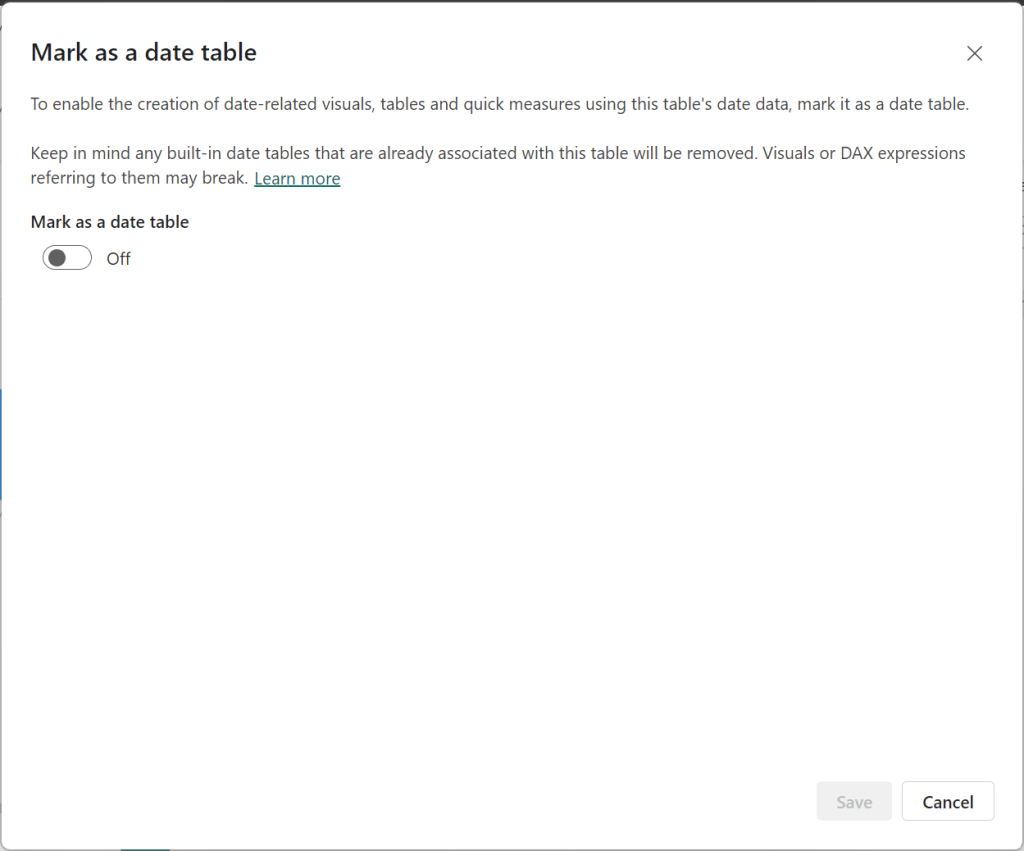
1. A Dedicated Date Table

  • One row per date
  • Continuous date range (no gaps)
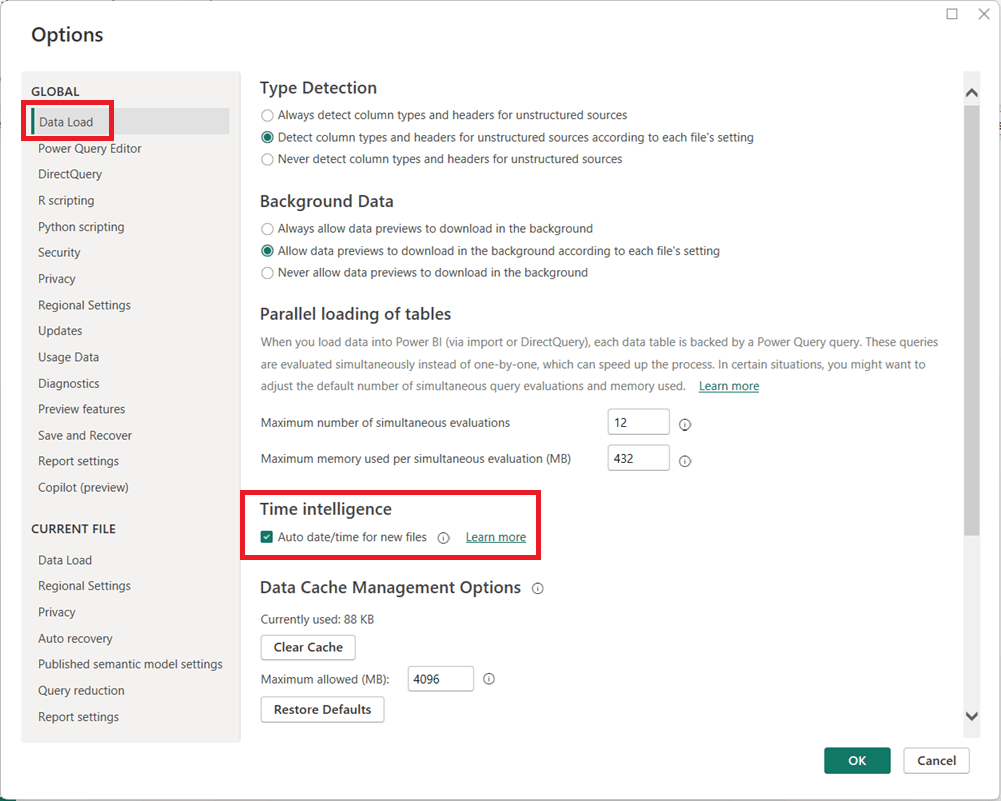
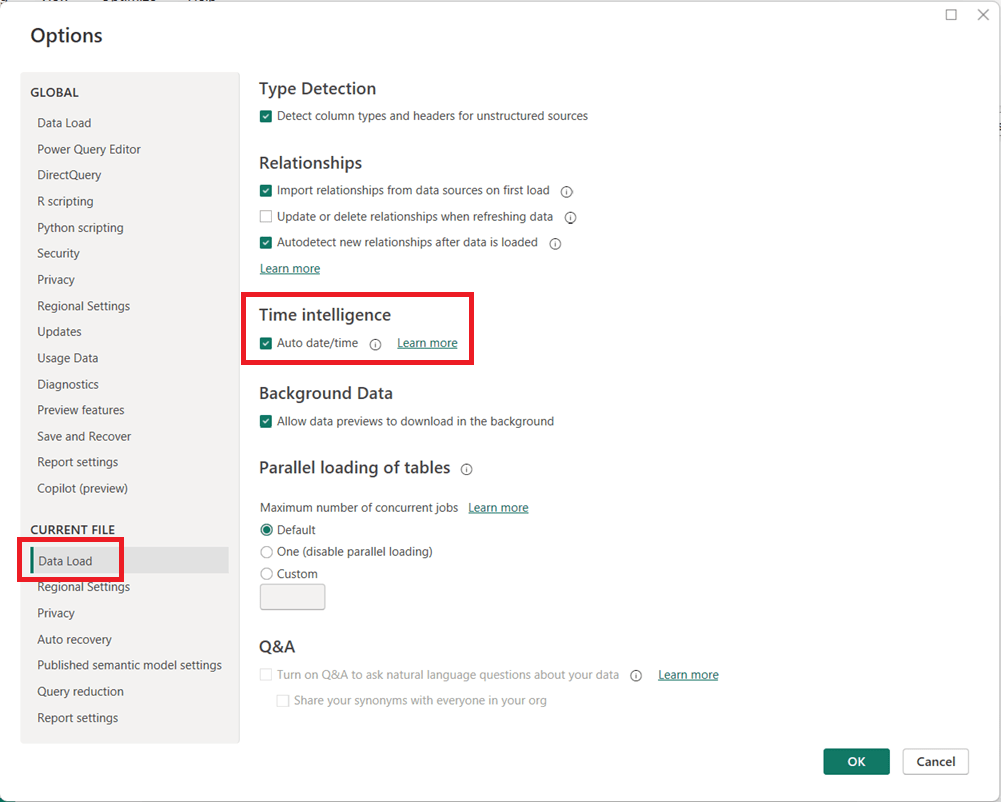
  • Marked as a Date table in Power BI

2. Proper Relationships

  • Date table related to fact tables
  • Relationship uses the date column (not datetime, if possible)

3. Correct Data Types

  • Date column must be of type Date
  • Not text or integer

⚠️ Exam Tip:
Many PL-300 questions are trick questions where time intelligence fails because one of these prerequisites is missing.


Role of CALCULATE in Time Intelligence

All built-in time intelligence functions work by modifying filter context using CALCULATE.

Example:

Sales YTD =
CALCULATE(
    [Total Sales],
    DATESYTD(Date[Date])
)

👉 CALCULATE changes the filter context to include all dates from the start of the year through the current date.


Common Time Intelligence Functions (PL-300 Focus)

Year-to-Date (YTD)

Sales YTD =
CALCULATE(
    [Total Sales],
    DATESYTD(Date[Date])
)

Month-to-Date (MTD)

Sales MTD =
CALCULATE(
    [Total Sales],
    DATESMTD(Date[Date])
)

Quarter-to-Date (QTD)

Sales QTD =
CALCULATE(
    [Total Sales],
    DATESQTD(Date[Date])
)


Previous Period Comparisons

Previous Year

Sales PY =
CALCULATE(
    [Total Sales],
    SAMEPERIODLASTYEAR(Date[Date])
)

Previous Month

Sales PM =
CALCULATE(
    [Total Sales],
    DATEADD(Date[Date], -1, MONTH)
)

Exam Insight:
SAMEPERIODLASTYEAR requires a continuous date table—a common failure point on the exam.


Rolling and Moving Averages

Rolling 12 Months

Sales Rolling 12M =
CALCULATE(
    [Total Sales],
    DATESINPERIOD(
        Date[Date],
        MAX(Date[Date]),
        -12,
        MONTH
    )
)

This pattern is commonly tested in scenario-based questions.


Growth and Variance Measures

Year-over-Year Growth

Sales YoY Growth =
[Total Sales] - [Sales PY]

Year-over-Year Percentage

Sales YoY % =
DIVIDE(
    [Total Sales] - [Sales PY],
    [Sales PY]
)

⚠️ Exam Tip:
Always use DIVIDE() instead of / to safely handle divide-by-zero scenarios.


Time Intelligence vs Custom Date Logic

Built-in Time IntelligenceCustom Logic
Requires date tableCan work without one
Simpler syntaxMore flexible
Optimized by engineMore complex
Preferred for PL-300Tested less often

👉 For PL-300, Microsoft prefers built-in time intelligence functions.


Common Mistakes (Often Tested)

  • Using time intelligence without marking a date table
  • Using text-based dates
  • Missing dates in the calendar
  • Using fact table dates instead of a shared date dimension
  • Expecting time intelligence to work in calculated columns

Best Practices for PL-300 Candidates

  • Always create and mark a common date table
  • Build reusable base measures
  • Use built-in time intelligence when possible
  • Validate results at different grain levels (year, month, day)
  • Avoid time intelligence in calculated columns

How This Appears on the Exam

Expect questions that:

  • Ask why a YTD or PY measure returns incorrect results
  • Test which function to use for a specific time comparison
  • Require selecting the correct DAX pattern
  • Identify missing prerequisites in a data model

Key Takeaways

  • Time intelligence is a high-value exam topic
  • Depends on a proper date table and relationships
  • Uses CALCULATE to modify filter context
  • Enables YTD, PY, rolling totals, and growth analysis
  • Frequently appears in scenario-based questions

Practice Questions

Go to the Practice Exam Questions for this topic.

How to turn off Auto date/time in Power BI and why you might want to

Power BI includes a feature called Auto date/time that automatically creates hidden date tables for date columns in your model. While this can be helpful for quick analyses, it can also introduce performance issues and modeling complexity in more advanced or production-grade reports.

What Is Auto Date/Time?

When Auto date/time is enabled, Power BI automatically generates a hidden date table for every column of type Date or Date/Time. These tables allow you to use built-in time intelligence features (like Year, Quarter, and Month) without explicitly creating a calendar table.

Why Turn Off Auto Date/Time?

Disabling Auto date/time is often considered a best practice for the following reasons:

  • Better Performance
    Each date column gets its own hidden date table, which increases model size and can slow down report performance.
  • Cleaner Data Models
    Hidden tables can clutter the model and make debugging DAX calculations more difficult.
  • Consistent Time Intelligence
    Using a single, well-designed Date (Calendar) table ensures consistent logic across all measures and visuals.
  • More Control
    Custom calendar tables allow you to define fiscal years, custom week logic, holidays, and other business-specific requirements.

How to Turn Off Auto Date/Time in Power BI

You can disable Auto date/time in both Power BI Desktop and at the report level:

  1. In Power BI Desktop, go to FileOptions and settingsOptions.
  2. Under Global, select Data Load.
  3. Uncheck Auto date/time for new files.
  1. (Optional but recommended) Under Current File, select Data Load and uncheck Auto date/time to disable it for the current report.
  1. Click OK and refresh your model if necessary.

When Should You Leave It On?

Auto date/time can still be useful for:

  • Quick prototypes or ad-hoc analysis
  • Simple models with only one or two date fields
  • Users new to Power BI who are not yet working with custom DAX time intelligence

Final Thoughts

For enterprise, reusable, or performance-sensitive Power BI models, turning off Auto date/time and using a dedicated Date table is usually the better approach. It leads to cleaner models, more reliable calculations, and greater long-term flexibility as your reports grow in complexity.

Thanks for reading!

Setting a table as a date table in Power BI to be able to use the delivered Time Intelligence functions

It is common to have the need to perform time-driven analysis on your data. For example, you may need to compare this month’s sales with the sales from the same period a year ago or you may need to calculate the number of days between two dates. Power BI provides a set of Time Intelligence functions that make it easy to perform these types of calculations. But to take advantage of the Time Intelligence functions in Power BI, you must have a date table in your Power BI model and to have that you will need to “mark” a table as a date table.

To mark a table as a date table, it must meet the following criteria:

  • It must have a column of data type “Date” or “Date/time”. This will be referred to as the “date column”.
  • The date column must contain unique date values. For example, you cannot have the value “3/1/2022” (or any other date value) listed twice (or more than once) in the table.
  • The date column must not contain BLANKs or NULLs. Only unique date values should be in the table’s date column.
  • The date column must not have any missing dates or gaps in dates. For example, you cannot have 1/1/2022 and then 1/3/2022 and not have 1/2/2022 in the date values.
  • The date column must span full years. Keep in mind that a year isn’t necessarily a calendar year (January-December), but should cover the entire 12 months, such as all dates between July 1, 2022 – June 30, 2023, inclusive. If you have less than one year’s dates in your table, then the range can be less than a year, but there cannot be any gaps. Also,

Once these rules are met, you can then mark the table as the date table. To do this, you can either right-click on the table in the Data pane and select “Mark as date table” (as shown below):

Or with the table selected in the Data pane, from the Table Tools tab, click on the “Mark as date table” icon. This icon will be grayed out if there are no date columns in the table.

The “Mark as date table” dialog opens (which includes a warning), from which you can turn on the “Mark as date table” flag.

Turn on the flag, and then select / set the date column from the dropdown.

Power BI will then validate your data to make sure all the criteria is met for the chosen column. If you get an error, make the necessary changes and try again.

Thanks for reading!