COUNT vs. COUNTA in Power BI DAX: When and How to Use Each

When building measures in Power BI using DAX, two commonly used aggregation functions are COUNT and COUNTA. While they sound similar, they serve different purposes and choosing the right one can prevent inaccurate results in your reports.

COUNT: Counting Numeric Values Only

The COUNT function counts the number of non-blank numeric values in a column.

DAX syntax:
COUNT ( Table[Column] )

Key characteristics of COUNT”:

  • Works only on numeric columns
  • Ignores blanks
  • Ignores text values entirely

When to use COUNT:

  • You want to count numeric entries such as:
    • Number of transactions
    • Number of invoices
    • Number of scores, quantities, or measurements
  • The column is guaranteed to contain numeric data

Example:
If Sales[OrderAmount] contains numbers and blanks, COUNT(Sales[OrderAmount]) returns the number of rows with a valid numeric amount.

COUNTA: Counting Any Non-Blank Values

The COUNTA function counts the number of non-blank values of any data type, including text, numbers, dates, and Boolean values.

DAX syntax:
COUNTA ( Table[Column] )

Key characteristics of “COUNTA”:

  • Works on any column type
  • Counts text, numbers, dates, and TRUE/FALSE
  • Ignores blanks only

When to use COUNTA:

  • You want to count:
    • Rows where a column has any value
    • Text-based identifiers (e.g., Order IDs, Customer Names)
    • Dates or status fields
  • You are effectively counting populated rows

Example:
If Customers[CustomerName] is a text column, COUNTA(Customers[CustomerName]) returns the number of customers with a non-blank name.

COUNT vs. COUNTA: Quick Comparison

FunctionCountsIgnoresTypical Use Case
COUNTNumeric values onlyBlanks and textCounting numeric facts
COUNTAAny non-blank valueBlanks onlyCounting populated rows

Common Pitfall to Avoid

Using COUNTA on a numeric column can produce misleading results if the column contains zeros or unexpected values. Remember:

  • Zero (0) is counted by both COUNT and COUNTA
  • Blank is counted by neither

If you are specifically interested in numeric measurements, COUNT is usually the safer and clearer choice.

In Summary

  • Use COUNT when the column represents numeric data and you want to count valid numbers.
  • Use COUNTA when you want to count rows where something exists, regardless of data type.

Understanding this distinction ensures your DAX measures remain accurate, meaningful, and easy to interpret.

Thanks for reading!

Merging Two Excel Files or Sheets Using Power Query (with the merge based on Multiple Columns)

Excel Power Query is a powerful, no-code/low-code tool that allows you to combine and transform data from multiple sources in a repeatable and refreshable way. One common use case is merging two Excel files or worksheets based on multiple matching columns, similar to a SQL join. Power Query is a major part of Power BI, but it can be used in Excel.

When to Use Power Query for Merging

Power Query is ideal when:

  • You receive recurring Excel files with the same structure
  • You need a reliable, refreshable merge process
  • You want to avoid complex formulas like VLOOKUP or XLOOKUP across many columns

Step-by-Step Overview

1. Load Both Data Sources into Power Query

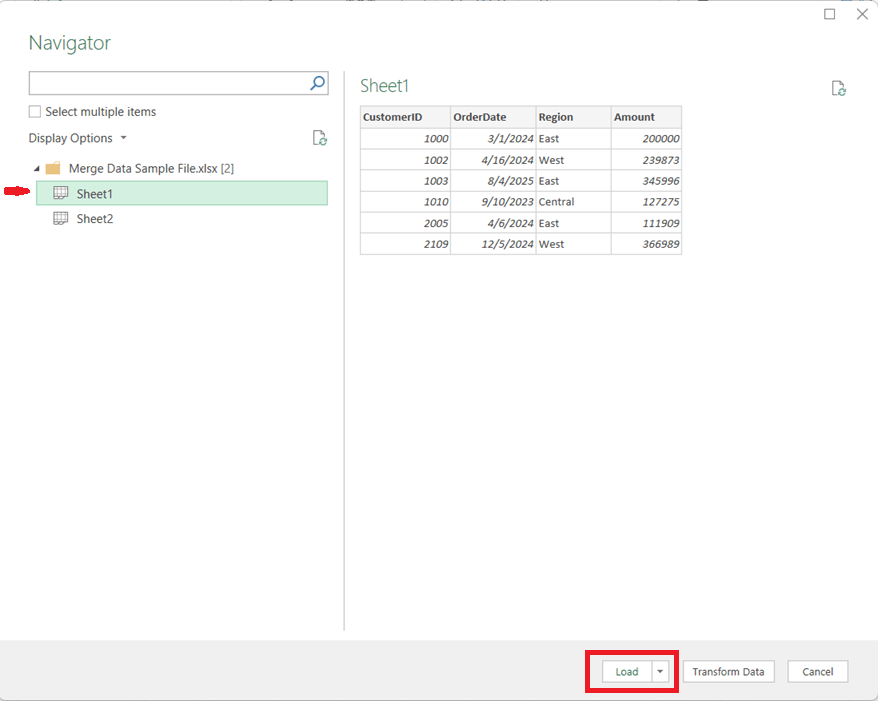
  • Open Excel and go to Data → Get Data
  • Choose From Workbook (for separate files) or From Table/Range (for sheets in the same file)

Tip: Ensure the columns you plan to merge on have the same data types (e.g., text vs. number).


  • Load each dataset into Power Query as a separate query

2. Start the Merge Operation

  • In Power Query, select the primary table
  • Go to Query → Merge Queries
  • Choose the secondary table from the dropdown

3. Select Multiple Matching Columns

  • Click the first matching column in the primary table
  • Hold Ctrl (or Cmd on Mac) and select additional matching columns
  • Repeat the same column selections in the secondary table, in the same order

For example, if you needed to perform the merge on CustomerID, OrderDate, and Region, you would click Customer ID, then hold the Ctrl key and click OrderDate, then (while still holding down the Ctrl key) click Region.

Power Query treats this as a composite key, and all selected columns must match for rows from both tables to merge.


4. Choose the Join Type

Select the appropriate join kind:

  • Left Outer – Keep all rows from the first table (most common) and brings in the values for the matching rows from the second table
  • Inner – Keep only matching rows from both tables
  • Full Outer – Keep all rows from both tables, merging the table where there is a match and having just the values from the respective tables when there is no match

Click OK to complete the merge.


5. Expand the Merged Data

  • A new column appears containing nested tables
  • Click the expand icon to select which columns to bring in
  • Remove unnecessary columns to keep the dataset clean

6. Load and Refresh

  • Click Close & Load
  • The merged dataset is now available in Excel
  • When source files change, simply click Refresh to update everything automatically

Key Benefits

  • Handles multi-column joins cleanly and reliably
  • Eliminates fragile lookup formulas
  • Fully refreshable and auditable
  • Scales well as data volume grows

In Summary

Using Power Query to merge Excel data on multiple columns brings database-style joins into Excel, making your workflows more robust, maintainable, and professional. Once set up, it saves time and reduces errors—especially for recurring reporting and analytics tasks.

Thanks for reading!

AI in Financial Services: From Back Office Automation to Intelligent Decision-Making

Few industries have embraced AI as broadly—or as aggressively—as financial services. Banks, insurers, investment firms, and fintechs operate in data-rich, highly regulated environments where speed, accuracy, and trust matter. AI is increasingly the engine that helps them balance all three.

How AI Is Being Used Today

AI shows up across nearly every function in financial services:

  • Fraud Detection & Risk Monitoring
    Machine learning models analyze transactions in real time to identify suspicious patterns, often catching fraud faster and more accurately than rule-based systems. PayPal utilizes AI-powered systems to detect fraud by comparing transactions with historical patterns, reducing financial losses. This is extremely critical in this time of rampant fraud. Financial Institutions also use AI to analyze real-time working capital and historical data to forecast financial performance and predict trends with greater accuracy.
  • Credit Scoring & Underwriting
    AI evaluates borrower risk using far more signals than traditional credit scores, including transaction behavior and alternative data (where regulations allow). Upstart, an AI-based lending platform, uses non-traditional data to assess creditworthiness, approving loans quickly for customers who might otherwise be denied by conventional models.
  • Customer Service & Virtual Assistants
    Chatbots and voice assistants handle balance inquiries, dispute tracking, loan status updates, and more—freeing human agents for complex cases. Bank of America’s Erica, a virtual assistant, assists customers with account information, bill payments, and personalized financial advice through chat or voice.
  • Algorithmic & Quantitative Trading
    AI models analyze market signals, news sentiment, and historical trends to inform trading strategies and portfolio optimization. Goldman Sachs uses generative AI to optimize trading strategies and forecast market trends, gaining a competitive edge in dynamic markets.
  • Compliance & AML (Anti–Money Laundering)
    AI tools assist in ensuring compliance with regulatory requirements by automating the monitoring transactions and reporting. This reduces the risk if non-compliance and associated penalties. HSBC utilizes AI to process compliance documents efficiently, ensuring adherence to evolving regulations and minimizing manual errors. AI also helps identify money laundering patterns, reduce false positives, and prioritize investigations.
  • Personalized Financial Advice
    Robo-advisors and recommendation engines tailor savings, investment, and retirement strategies to individual customers. Wells Fargo’s predictive banking feature provides personalized prompts about future financial activities leading to improved user engagement.

Tools, Technologies, and Forms of AI

Financial services organizations typically use a layered AI stack:

  • Machine Learning & Deep Learning
    Core to fraud detection, risk modeling, and forecasting.
  • Natural Language Processing (NLP)
    Used to analyze customer communications, earnings reports, regulatory filings, and market news.
  • Generative AI & Large Language Models (LLMs)
    Emerging use cases include advisor copilots, automated report generation, customer communication drafting, and internal knowledge search.
  • AI Platforms & Infrastructure
    Cloud platforms like AWS, Azure, and GCP provide scalable ML services, while many firms also invest in proprietary, on-prem models for sensitive workloads.
  • Decision Intelligence & Optimization Models
    AI combined with rules engines to support pricing, underwriting, and capital allocation decisions.
  • Blockchain and AI Integration
    Blockchain and AI integration will redefine how financial transactions are managed, enhancing security, transparency, and efficiency. Blockchain technology ensures trust and accountability, while AI improves transaction validation and fraud detection. Together, these technologies will streamline cross-border payments, smart contracts, and digital identities, creating a more secure and efficient financial ecosystem.

Benefits Financial Institutions Are Seeing

Organizations that have successfully deployed AI are seeing tangible gains:

  • Reduced Fraud Losses and faster detection
  • Lower Operating Costs through automation of high-volume tasks and improved efficiencies
  • Improved Customer Experience with faster responses and personalization
  • Better Risk Management via more dynamic and data-driven models
  • Increased Revenue through smarter cross-sell, upsell, and pricing strategies

In short, AI helps firms move from reactive decision-making to proactive, predictive operations.

Pitfalls and Challenges

Despite the promise, AI in financial services comes with real risks:

  • Bias and Fairness Concerns
    AI models can unintentionally reinforce historical bias in lending or underwriting decisions, creating regulatory and ethical challenges.
  • Model Explainability
    Regulators and auditors often require clear explanations for decisions—something black-box models struggle to provide.
  • Data Quality and Silos
    Poor data governance leads to unreliable models and failed AI initiatives.
  • Regulatory Risk
    Financial institutions must ensure AI usage aligns with evolving regulations across regions.
  • Overhyped Projects
    Some AI initiatives fail because they chase cutting-edge technology without clear business ownership or measurable outcomes.

Where AI Is Headed in Financial Services

Looking ahead, several trends are emerging:

  • AI as a Copilot, Not a Replacement
    Advisors, underwriters, and analysts will increasingly work alongside AI systems that augment—not replace—human judgment.
  • More Explainable and Governed AI
    Expect increased focus on transparency, auditability, and model governance.
  • Real-Time, Embedded Intelligence
    AI will be embedded directly into workflows—credit decisions, claims processing, and trade execution—rather than sitting in separate tools.
  • Greater Use of Generative AI
    From personalized financial guidance to internal knowledge assistants, GenAI will reshape how employees and customers interact with financial systems.

How Financial Services Companies Can Gain an Advantage

To stay ahead in this fast-changing landscape, organizations should:

  1. Start with High-Impact Use Cases
    Focus on areas like fraud, customer experience, or risk where ROI is clear.
  2. Invest in Data Foundations
    Clean, well-governed data is more valuable than the most advanced model.
  3. Build AI Governance Early
    Fairness, explainability, and compliance should be part of design—not afterthoughts.
  4. Upskill the Workforce
    AI-literate business leaders and domain experts are just as important as data scientists.
  5. Blend Human and Machine Intelligence
    The most successful systems pair AI recommendations with human oversight.

Final Thoughts

AI is no longer experimental in financial services—it’s essential infrastructure. Firms that treat AI as a strategic capability, grounded in strong data practices and responsible governance, will be best positioned to innovate, compete, and earn trust in an increasingly intelligent financial ecosystem.

Are you using AI in the financial services industry? Share how and what you have learned from your journey.

This article is a part of an “AI in …” series that shares information about AI in various industries and business functions. Be on the lookout for future (and past) articles in the series.

Other “AI in …” articles in the series:

AI in the Hospitality Industry: Transforming Guest Experiences and Operations

AI in Gaming: How Artificial Intelligence is Powering Game Production and Player Experience

AI in Healthcare: Transforming Patient Care and Clinical Operations

Thanks for reading and good luck on your data journey!

How to update your Power BI source file location

The location of your source files has changed, and now you need to update your Power BI report to use the new location. To update the directory or location of your source file, in Power BI Desktop, click Transform Data -> Data Source Settings 

Then click on the entry that corresponds to the path you need to update.

Update or entirely change the path and click ok. Apply your changes.

It becomes a little more complicated when you are changing a local folder to a SharePoint location, which we will cover in another post, but for changing location of single files, it’s that simple. 

Thanks for reading!

Power BI load error: load was cancelled by error in loading a previous table

You may run into this error when loading Power BI:

"load was cancelled by error in loading a previous table"

If you do get this error, keep scrolling down to see what the “inducing” error is. This message is an indication that there was an error previous to getting to the current table in the process. The real, initial error will be more descriptive. Start with resolving that error(s), and then this one will go away.

I hope you found this helpful.

Power BI refresh error: Column ‘X’ in table ‘Y’ contains blank values and this is not allowed for columns on the one-side of a many-to-one relationship or for columns that are used as the primary key of a table

I was getting this error message when I attempted to refresh a Power BI application:

"Column 'Date' in table 'Date Dim' contains blank values and this is not allowed for columns on the one-side of a many-to-one relationship or for columns that are used as the primary key of a table"

However, despite what the message indicated, I double-checked and confirmed that I did not have any blank values in the ‘Date Dim’ table.

It turns out that you may also get this error (although incorrectly worded in my opinion) if the blanks are in the joining table. In my case, I had blanks in a ‘Snapshot Date’ column in the fact table that was joined to the ‘Date Dim’ table. Once these blanks were filled, the refresh ran without error.

One thing to look out for in these cases (since this is what happened in my case), if your source is Excel, undo all filters to make sure that you do not have any rows being filtered out when checking for blanks values across your columns, because this could potentially inadvertently hide the rows with the blank values and cause you to miss them.

I hope you found this helpful.

AI in Healthcare: Transforming Patient Care and Clinical Operations

Artificial Intelligence (AI) is redefining healthcare at every level—speeding and improving patient care, enhancing diagnostic accuracy, personalizing treatments, speeding drug delivery, and streamlining hospital operations. As global health systems grapple with rising costs, staff shortages, and complex patient needs, AI has emerged as a critical force for innovation. From radiology to drug discovery, AI is no longer experimental; it is becoming a cornerstone of modern medicine.

AI in healthcare is expected to exceed a whopping $600B by 2034, according to one forecast. The explosion of digital healthcare records has created vast opportunities for AI to uncover and use patterns and insights across the spectrum of healthcare.

How AI Is Being Used in Healthcare

AI’s applications in healthcare are vast and growing. Here are a few examples:

  • Medical Imaging and Diagnostics: AI algorithms can analyze X-rays, MRIs, and other medical images to detect diseases, such as cancer and heart conditions.
  • Virtual Health Assistants: As in every industry, AI chatbots and symptom checkers (e.g., Ada Health, Babylon Health) provide patients with 24/7 support proving information and answers to questions, triage guidance, medication refills, and appointment scheduling.
  • Predictive Analytics: Hospitals use AI to forecast patient admissions, identify those at risk for readmission, and anticipate Emergency / ICU demand. AI can predict the risk of developing certain diseases based on patient data, such as medical history, lifestyle, and genetic information.
  • Personalized Medicine: AI will help to develop with better precision personalized treatment plans and medications/supplements for patients.
  • General Research & Development: AI is being used in medical research to analyze massive datasets in order to develop new treatments and improve patient care and outcomes.
  • Drug Discovery and Development: AI models from companies like BenevolentAI and Insilico Medicine accelerate the identification of potential compounds, reducing the timeline from years to months.
  • Robotic Surgery: AI-powered robotic systems can assist surgeons with complex procedures, improving precision and minimizing invasiveness. Systems like the da Vinci Surgical System use AI-assisted robotics to improve surgical precision and minimize recovery times.
  • Administrative Automation: AI streamlines billing, coding, and claims management to reduce paperwork and human error. AI-powered systems can also automate appointment scheduling and reminders. This will help with staff shortages and reduce staff burnout.
  • Billing, coding and health insurance processing: AI can analyze medical records and automate insurance processing and billing, thus improving efficiency, reducing errors, and reducing staff hours.
  • Fraud detection: AI algorithms can identify suspicious patterns in healthcare claims, leading to reducing in fraud.
  • Pregnancy Management: AI applications are used to monitor the health of both mother and fetus through wearable devices and monitored data.

And the healthcare use cases go on and on.

Tools, Technologies, and Methods Behind AI in Healthcare

Healthcare AI encompasses a wide variety of solutions and, therefore, draws on a mix of advanced technologies and methods:

  • Machine Learning (ML) for patient risk stratification, disease progression modeling, and outcome prediction.
  • Natural Language Processing (NLP) to analyze unstructured clinical notes, extract insights from medical records, and power conversational interfaces.
    • for example: Healthcare Text Analysis: In the healthcare sector, Azure’s language solutions are used to extract clinical information from unstructured medical documents. Features like entity recognition and text analytics for health help identify symptoms, medications, and diagnoses, supporting faster and more accurate decision-making.
  • Computer Vision in radiology, pathology, and dermatology for image-based diagnostics.
  • Robotics for surgeries, rehabilitation support, and hospital logistics (e.g., delivery robots for medications).
  • Cloud AI Platforms such as Microsoft Azure Health Data Services, AWS HealthLake, and Google Cloud Healthcare API for data integration and analysis.
  • Generative AI for drug molecule design, synthetic medical data creation, and personalized patient communication.
  • Google’s DeepMind and IBM Watson Health assist radiologists in detecting conditions such as cancer, stroke, and heart disease earlier and with higher precision.
  • IDx-DR, an FDA-approved AI tool, diagnoses diabetic retinopathy by analyzing eye images, helping to prevent irreversible damage through early detection.
  • AI-powered drug discovery tool, Atomwise, has successfully identified potential treatments for diseases like Ebola within a day.
  • Aidoc, an AI-driven radiology platform, prioritizes critical cases and detects abnormalities in medical images, significantly enhancing diagnosis and treatment.
  • Dragon Medical One uses speech recognition and speech-to-text features to assist healthcare providers with documenting patient notes, leading to time savings and better accuracy.

Benefits of AI in Healthcare

The adoption of AI has brought measurable benefits across the sector:

  • Improved Diagnostics: AI-powered imaging tools have demonstrated higher sensitivity in detecting certain conditions than human experts alone.
  • Personalized Care: AI helps tailor treatment plans to individual patient profiles, improving outcomes.
  • Operational Efficiency: Predictive analytics optimize staffing, reduce wait times, and cut costs.
  • Faster Drug Development: AI-driven discovery platforms shorten the drug development cycle, lowering costs and improving pipeline success.
  • Accessibility: Virtual assistants extend care access to underserved populations by providing round-the-clock guidance.

Pitfalls and Challenges of AI in Healthcare

Despite the proven results and huge promise, several challenges and risks persist:

  • Data Quality: While significant amounts of data are available, not all of it is of high quality, and significant efforts are needed to ensure that the data driving AI solutions is clean and accurate.
  • Data Bias and Inequality: AI models trained on non-diverse datasets may produce biased outcomes, particularly for underrepresented populations.
  • Regulatory Hurdles: The FDA and other agencies require rigorous testing and approval, slowing AI adoption.
  • Failed Projects: IBM Watson Health, once hyped as a revolutionary tool, failed to meet expectations in oncology due to overpromising and underdelivering.
  • Data Privacy Concerns: With vast amounts of sensitive data, breaches or misuse pose serious risks.
  • Integration Challenges: Many hospitals face difficulties embedding AI into legacy systems and workflows.
  • High AI Costs: AI solutions are rarely cheap, and not all healthcare companies can afford what they desire. Companies need to carefully and strategically choose which solutions to implement.
  • Overreliance on AI: Excessive trust in algorithms could lead to errors if not combined with human oversight.

The Future of AI in Healthcare

The trajectory of AI points toward deeper integration into healthcare delivery:

  • Precision Medicine at Scale: AI will increasingly guide genomics-driven treatments, tailoring care to a patient’s DNA profile.
  • Real-Time Monitoring: Wearables and IoT devices paired with AI will continuously track patient health and alert clinicians to early warning signs.
  • Generative AI in Research: AI will help simulate clinical trials and accelerate hypothesis generation.
  • Holistic Care Platforms: AI-powered systems will unify patient data from hospitals, clinics, and home devices into seamless health records.
  • Ethical AI Frameworks: Future AI systems will be built with fairness, accountability, and transparency at their core.

How Healthcare Organizations Can Gain an Advantage

To stay competitive and maximize AI’s potential, healthcare providers and companies should:

  1. Invest in High-Quality Data: Ensure datasets are diverse, representative, and securely stored.
  2. Adopt AI Incrementally: Start with specific use cases—such as imaging, scheduling, or claims processing—before scaling enterprise-wide.
  3. Prioritize Human-AI Collaboration: Position AI as a support tool to augment, not replace, clinicians.
  4. Strengthen Compliance and Ethics: Build governance frameworks around data privacy, bias mitigation, and transparency.
  5. Train and Upskill Staff: Equip medical professionals and administrators with the skills to effectively use AI.
  6. Foster Partnerships: Collaborate with AI startups, academic research labs, and technology providers for faster innovation.

Conclusion

AI in healthcare represents both extraordinary promise and complex challenges. It is already improving patient outcomes, optimizing hospital operations, and reducing the time and cost of drug development. Yet, for every breakthrough, there are lessons in bias, regulation, and integration that remind us AI is not a silver bullet. However, its adoption and success rates in healthcare, and across the board, is expected to grow significantly. Not using AI is not an option. The future belongs to healthcare organizations that use AI responsibly and effectively—balancing innovation with ethics, automation with compassion, and efficiency with equity.

This article is a part of an “AI in …” series that shares information about AI in various industries and business functions. Be on the lookout for future (and past) articles in the series.

Thanks for reading and good luck on your data (AI) journey!

Other “AI in …” articles in the series:

AI in the Hospitality Industry: Transforming Guest Experiences and Operations

AI in Gaming: How Artificial Intelligence is Powering Game Production and Player Experience

Developing metrics for your analytics project

When starting an analytics project, one of the most important decisions you will make is identifying the right metrics. Metrics serve as the compass for the initiative—they show whether you are on the right track, communicate achievements, highlight challenges, uncover blind spots, and ultimately, along with guiding future decisions, they demonstrate the value of the project to stakeholders. But designing metrics is not as simple as picking a single “success number.” To truly guide decision-making, you need a holistic set of measures that reflect multiple dimensions of performance.

Why a Holistic View Matters

Analytics projects sometimes fall into the trap of focusing on only one type of metric. For example, a project might track quantity (e.g., number of leads generated) while ignoring quality (e.g., lead conversion rate). Or it may measure cost savings but fail to consider user satisfaction, leading to short-term wins but long-term disengagement.

Develop Metrics from Multiple Dimensions

To avoid this pitfall, it’s critical to develop a balanced framework that includes multiple perspectives:

  • Quantity: How much output is produced? Examples include number of units produced, sales revenue, or number of new customers added.
  • Quality: What is the quality of the output? Examples include accuracy rates, defect counts, or error percentages.
  • Time: How long does it take to achieve the output? Or in other words, what timeframe is the quantity and quality measured over? Is it Sales revenue per hour, per day, per month, or per year?
  • Costs: What resources are being consumed? Metrics might include infrastructure costs, labor hours and costs, materials costs, or overall project spend.
  • Satisfaction: How do stakeholders, customers, or employees feel about the results? Feedback surveys, adoption rates, product ratings, and net promoter scores (NPS) are common ways of identifying this information.

Each of these perspectives contributes to the full story of your analytics project. If one dimension is missing, you risk optimizing for one outcome at the expense of another.

Efficiency, Effectiveness, and Impact Metrics

Another way you can classify your metrics to achieve a holistic view is with three overarching categories: Efficiency, Effectiveness, and Impact.

  • Efficiency Metrics
    • These measure how well resources are used and answers “are we doing things right?“. They focus on inputs versus outputs.
      • Example: “Average work hours per product” shows how quickly work gets done.
      • Example: “Cost per customer acquired” reflects the efficiency of your sales operations.
    • Efficiency metrics often tie directly to quantity, cost, and time.
  • Effectiveness Metrics
    • These measure how well goals are achieved—whether the project delivers the intended results, and answers “are we doing the right things?“.
      • Example: “Customer satisfaction” demonstrates how happy customers are with our products and services.
      • Example: “Actual to Target” shows how things are tracking compared to the goals that were set.
    • Effectiveness metrics often involve quality, satisfaction, and time.
  • Impact Metrics
    • These measure the broader business or organizational outcomes influenced by some activity.
      • Example: “Market share and revenue growth” shows financial state from a broader market and overall standpoint.
      • Example: “Return on Investment (ROI)” is the ultimate metrics for financial performance.
    • Impact metrics communicates how we are doing with our long-term, strategic goals. They often combine quantity, quality, satisfaction, and time dimensions.

The Significance of the Time Dimension

Among all the dimensions used in metrics, time is especially powerful because it adds critical context to nearly every metric. Without time, numbers can be misleading. Just about all metrics are more relevant when the time component is added. Time transforms static measures into dynamic insights. For instance:

  • A quantity metric of “100 new customers” becomes far more meaningful when paired with “this month” versus “since company founding.”
  • A quality metric of “95% data accuracy” is less impressive if it takes weeks to achieve, compared to real-time cleansing.
  • A cost metric of “$100,000 project spend” raises different questions depending on whether it’s a one-time investment or a recurring monthly expense.

By always asking, “Over what time frame?”, you unlock a truer understanding of performance. In short, the time dimension transforms static measures into dynamic insights. It allows you to answer not just “What happened?” but also “When did it happen?”, “How long did it take?”, and “How is it changing over time?”—questions that are generally crucial for actionable decision-making.

Time adds context to every other metric. Think of it as the axis that brings your measures to life. Quantity without time tells you how much, but not how fast. Quality without time shows accuracy, but not whether results are timely enough to act upon. Costs without time hide the pace at which expenses accumulate. And satisfaction without time misses whether perceptions improve, decline, or stay consistent over an initiative’s lifecycle.

The Significance of the Timeliness

Another important consideration is timeliness. Metrics must be accessible to decision makers in a timely manner to allow them to make timely decisions. For example:

  • A metric may deliver accurate insights, but if it takes three weeks to refresh the data and the dashboard that displays it, the value erodes.
  • A machine learning model may predict outcomes with high accuracy, but if the scoring process delays operational decisions, the benefit diminishes.

Therefore, in addition to deciding on and building the metrics for a project, the delivery mechanism of the metrics (such as a dashboard) must also be thought out to ensure that the entire process, from data sourcing to aggregations to dashboard refresh for example, can all happen in a timely manner to, in turn, make the metrics available to users in a timely manner.

Putting It All Together

When developing metrics for your analytics project, take a step back and ensure you have a comprehensive, multi-angle approach, by asking:

  • Do we know how much is being achieved/produced (quantity)?
  • Do we know how well it is being achieved/produced (quality)?
  • Do we know how fast results are being delivered (time)?
  • Do we know how much it costs to achieve (costs)?
  • Do we know how it feels to those affected (satisfaction)?
  • Do we know whether we are efficiently using resources?
  • Do we know whether we are effective in reaching goals?
  • Do we know what impact this work is having on the organization?
  • And for the above questions, always get a perspective on time … when? over what timeframe?
  • When are updates to the metrics needed by (real-time, hourly, daily, weekly, monthly, etc.)?

By building metrics across these dimensions, you create a more reliable, meaningful, and balanced framework for measuring success. More importantly, you ensure that the analytics project supports not only the immediate technical objectives but also the broader organizational goals.

Thanks for reading! Good luck on your analytics journey!

AI in Gaming: How Artificial Intelligence is Powering Game Production and Player Experience

The gaming industry isn’t just about fun and entertainment – it’s one of the largest and fastest-growing industries in the world. Valued at over $250 billion in 2024, it’s expected to surge past $300 billion by 2030. And at the center of this explosive growth? Artificial Intelligence (AI). From streamlining game development to building creative assets faster to shaping immersive and personalized player experiences, AI is transforming how games are built and how they are played. Let’s explore how.

1. AI in Gaming Today

AI is showing up both behind the scenes (in development studios and in technology devices) and inside the games themselves.

  • AI Agents & Workflow Tools: A recent survey found that 87% of game developers already incorporate AI agents into development workflows, using them for tasks such as playtesting, balancing, localization, and code generation PC GamerReuters. For bug detection, Ubisoft developed Commit Assistant, an AI tool that analyzes millions of lines of past code and bug fixes to predict where new errors are likely to appear. This has cut down debugging time and improved code quality, helping teams focus more on creative development rather than repetitive QA.
  • Content & Narrative: Over one-third of developers utilize AI for creative tasks like dynamic level design, animation, dialogue writing, and experimenting with gameplay or story concepts PC Gamer. Games like Minecraft and No Man’s Sky use AI to dynamically create worlds, keeping the player experience fresh.
  • Rapid Concept Ideation: Concept artists use AI to generate dozens of initial style options—then pick a few to polish with humans. Way faster than hand-sketching everything Reddit.
  • AI-Powered Game Creation: Roblox recently announced generative AI tools that let creators use natural language prompts to generate code and 3D assets for their games. This lowers the barrier for new developers and speeds up content creation for the platform’s massive creator community.
  • Generative AI in Games: On Steam, roughly 20% of games released in 2025 use generative AI—up 681% year-on-year—and 7% of the entire library now discloses usage of GenAI assets like art, audio, and text Tom’s Hardware.
  • Immersive NPCs: Studios like Jam & Tea, Ubisoft, and Nvidia are deploying AI for more dynamic, responsive NPCs that adapt in real time—creating more immersive interactions AP News. These smarter, more adaptive NPCs react more realistically to player actions.
  • AI-Driven Tools from Tech Giants: Microsoft’s Muse model generates gameplay based on player interaction; Activision sim titles in Call of Duty reportedly use AI-generated content The Verge.
  • Playtesting Reinvented: Brands like Razer now embed AI into playtesting: gamers can test pre-alpha builds, and AI tools analyze gameplay to help QA teams—claiming up to 80% reduction in playtesting cost Tom’s Guide. EA has been investing heavily in AI-driven automated game testing, where bots simulate thousands of gameplay scenarios. This reduces reliance on human testers for repetitive tasks and helps identify balance issues and bugs much faster.
  • Personalized Player Engagement: Platforms like Tencent, the largest gaming company in the world, and Zynga leverage AI to predict player behavior and keep them engaged with tailored quests, events, offers, and challenges. This increases retention while also driving monetization.
  • AI Upscaling and Realism
    While not a game producer, NVIDIA’s DLSS (Deep Learning Super Sampling) has transformed how games are rendered. By using AI to upscale graphics in real time, it delivers high-quality visuals at faster frame rates—giving players a smoother, more immersive experience.
  • Responsible AI for Fair Play and Safety: Microsoft is using AI to detect toxic behavior and cheating across Xbox Live. Its AI models can flag harassment or unfair play patterns, keeping the gaming ecosystem healthier for both casual and competitive gamers.

2. Tools, Technologies, and Platforms

Let’s take a look at things from the technology type standpoint. As you may expect, the gaming industry uses several AI technologies:

  • AI Algorithms: AI algorithms dynamically produce game content—levels, dialogue, music—based on developer input, on the fly. This boosts replayability and reduces production time Wikipedia. And tools like DeepMotion’s animation generator and IBM Watson integrations are already helping studios prototype faster and more creatively Market.us
  • Asset Generation Tools: Indie studios like Krafton are exploring AI to convert 2D images into 3D models, powering character and world creation with minimal manual sculptingReddit.
  • AI Agents: AI agents run thousands of tests, spot glitches, analyze frame drops, and flag issues—helping devs ship cleaner builds fasterReelmindVerified Market Reports. This type of AI-powered testing reduces bug detection time by up to 50%, accelerates quality assurance, and simulates gameplay scenarios on a massive scale Gitnux+1.
  • Machine Learning Models: AI tools, typically ML models, analyze player behavior to optimize monetization, reduce churn, tailor offers, balance economies, anticipate player engagement and even adjust difficulty dynamically – figures range from 56% of studios using analytics, to 77% for player engagement, and 63% using AI for economy and balance modeling Gitnux+1.
  • Natural Language Processing (NLP): NLPs are used to power conversational NPCs or AI-driven storytelling. Platforms like Roblox’s Cube 3D and Ubisoft’s experimenting with AI to generate dialogue and 3D assets—making NPCs more believable and story elements more dynamic Wikipedia.
  • Generative AI: Platforms like Roblox are enabling creators to generate code and 3D assets from text prompts, lowering barriers to entry. AI tools now support voice synthesis, environmental effects, and music generation—boosting realism and reducing production costs GitnuxZipDoWifiTalents
  • Computer Vision: Used in quality assurance and automated gameplay testing, especially at studios like Electronic Arts (EA).
  • AI-Enhanced Graphics: NVIDIA’s DLSS uses AI upscaling to deliver realistic graphics without slowing down performance.
  • GitHub Copilot for Code: Devs increasingly rely on tools like Copilot to speed coding. AI helps write repetitive code, refactor, or even spark new logic ideas Reddit.
  • Project Scoping Tools: AI tools can forecast delays and resource bottlenecks. Platforms like Tara AI use machine learning to forecast engineering tasks, timelines, and resources—helping game teams plan smarter Wikipedia. Also, by analyzing code commits and communication patterns, AI can flag when teams are drifting off track. This “AI project manager” approach is still in its early days, but it’s showing promise.

3. Benefits and Advantages

Companies adopting AI are seeing significant advantages:

  • Efficiency Gains & Cost Savings: AI reduces development time significantly—some estimates include 30–50% faster content creation or bug testing WifiTalents+1Gitnux. Ubisoft’s Commit Assistant reduces debugging time by predicting where code errors may occur.
  • Rapid Concept Ideation: Concept artists use AI to generate dozens of initial style options—then pick a few to polish with humans. Way faster than hand-sketching everything Reddit.
  • Creative Enhancement: Developers can shift time from repetitive tasks to innovation—allowing deeper storytelling and workflows PC GamerReddit.
  • Faster Testing Cycles: Automated QA, asset generation, and playtesting can slash both time and costs (some developers report half the animation workload gone) PatentPCVerified Market Reports. For example, EA’s automated bots simulate thousands of gameplay scenarios, accelerating testing.
  • Increased Player Engagement & Retention: AI keeps things fresh and fun with AI-driven adaptive difficulty, procedural content, and responsive NPCs boost immersion and retention—users report enhanced realism and engagement by 35–45% Gitnux+2Gitnux+2. Zynga uses AI to identify at-risk players and intervene with tailored offers to reduce churn.
  • Immersive Experiences: DLSS and AI-driven NPC behavior make games look better and feel more alive.
  • Revenue & Monetization: AI analytics enhance monetization strategies, increase ad effectiveness, and optimize in-game economies—improvements around 15–25% are reported Gitnux+1.
  • Global Reach & Accessibility: Faster localization and AI chat support reduce response times and broaden global player reach ZipDoGitnux+1.

For studios, these benefits and advantages translate to lower costs, faster release cycles, and stronger player engagement metrics, resulting in less expenses and more revenues.

4. Pitfalls and Challenges

Of course, it’s not all smooth sailing. Some issues include:

  • Bias in AI Systems: Poorly trained AI can unintentionally discriminate—for example, failing to fairly moderate online communities.
  • Failed Investments: AI tools can be expensive to build and maintain, and some studios have abandoned experiments when returns weren’t immediate.
  • Creativity vs. Automation: Overreliance on AI-generated content risks creating bland, formulaic games. There’s worry about AI replacing human creators or flooding the market with generic, AI-crafted content Financial Times.
  • Legal Risks, Ethics & Originality: Issues around data ownership, creative rights, and transparency are raising developer anxiety ReutersFinancial Times. Is AI stealing from artists? Activision’s Black Ops 6 faced backlash over generative assets, and Fortnite’s Vader stirred labor concerns WikipediaBusiness Insider.
  • Technical Limitations: Not all AI tools hit the mark technically. Early versions of NVIDIA’s G-Assist (now patched) had performance problems – it froze and tanked frame rates – but is a reminder that AI isn’t magic yet and comes with risks, especially for early integrators of new tools/solutions. Windows Central.
  • Speed vs. Quality: Rushing AI-generated code without proper QA can result in outages or bugs—human oversight still matters TechRadar.
  • Cost & Content Quality Concerns: While 94% of developers expect long-term cost reductions, upfront costs and measuring ROI remain challenges—especially given concerns over originality in AI-generated content ReutersPC Gamer.

In general, balancing innovation with human creativity remains a challenge.

5. The Future of AI in Gaming

Looking ahead, we can expect:

  • More Personalized Gameplay: Games that adapt in real-time to individual player styles.
  • Generative Storytelling: Entire narratives that shift based on player choices, powered by large language models.
  • AI Co-Creators: Game development may become a hybrid of human creativity and AI-assisted asset generation.
  • Smarter Communities: AI will help moderate toxic behavior at scale, creating safer online environments.
  • Games Created from Prompts: Imagine generating a mini-game just by describing it. That future is teased in surveys, though IP and ethics may slow adoption PC Gamer.
  • Fully Dynamic Games: AI-generated experiences based on user prompts may become a reality, enabling personalized game creation—but IP concerns may limit certain uses PC Gamer.
  • NPCs That Remember and Grow: AI characters that adapt, remember player choices, and evolve—like living game companions WIREDFinancial Times.
  • Cloud & AR/VR Boost Growth: AI will optimize streaming, drive immersive data-driven VR/AR experiences, and power e-sports analytics Verified Market ReportsGrand View Research.
  • Advanced NPCs & Narrative Systems: Expect smarter, emotionally adaptive NPCs and branching narratives shaped by AI AP NewsGitnux.
  • Industry Expansion: The AI in gaming market is projected to swell—from ~$1.2 billion in 2022 to anywhere between $5–8 billion by 2028, and up to $25 billion by 2030 GitnuxWifiTalents+1ZipDo.
  • Innovation Across Studios: Smaller indie developers continue experimenting freely with AI, while larger studios take a cautious, more curated approach Financial TimesThe Verge.
  • Streaming, VR/AR & E-sports Integration: AI-driven features—matching, avatar behavior, and live content moderation—will grow more sophisticated in live and virtual formats Gitnux+2Gitnux+2Windows Central.

With over 80% of gaming companies already investing in AI in some form, it’s clear that AI adoption is accelerating and will continue to grow. Survival without it will become impossible.

6. How Companies Can Stay Ahead

To thrive in this fast-changing environment, gaming companies should:

  • Invest in R&D: Experiment with generative AI, NPC intelligence, and new personalization engines. Become proficient in the key tools and technologies.
  • Focus on Ethics: Build AI responsibly, with safeguards against bias and toxicity.
  • Upskill Teams: Developers and project managers need to understand and use AI tools, not just traditional game engines.
  • Adopt Incrementally: Start with AI in QA and testing (low-risk, high-reward) before moving into core gameplay mechanics.
  • Start with High-ROI Use Cases: Begin with AI applications like testing, balancing, localization, and analytics—where benefits are most evident.
  • Blend AI with Human Creativity: Use AI to augment—not replace—human designers and writers. Leverage it to iterate faster, then fine-tune for quality.
  • Ensure IP and Ethical Compliance: Clearly disclose AI use, respect IP boundaries, and integrate transparency and ethics into development pipelines.
  • Monitor Tools & Stay Agile: AI tools evolve fast—stay informed, and be ready to pivot as platforms and capabilities shift.
  • Train Dev Teams: Encourage developers to explore AI assistants, generative tools, and optimization models so they can use them responsibly and creatively.
  • Focus on Player Trust: Transparently communicating AI usage helps mitigate player concerns around authenticity and originality.
  • Scale Intelligently: Use AI-powered analytics to understand player behavior—then refine content, economy, and retention strategies based on real data.

There will be some trial and error as companies move into the new landscape and try/adopt new technologies, but companies must adopt AI and become good at using it to stay competitive.

Final Word

AI isn’t replacing creativity in gaming—it’s amplifying it. From Ubisoft’s AI bug detection to Roblox’s generative tools and NVIDIA’s AI-enhanced graphics, the industry is already seeing massive gains. As studios continue blending human ingenuity with machine intelligence, the games of the future will be more immersive, personalized, and dynamic than anything we’ve seen before. But it’s clear, AI will not be an option for game development, it is a must. Companies will need to become proficient with the AI tools they choose and how they integrate them into the overall production cycle. They will also need to carefully choose partners that help them with AI implementations that are not done with in-house personnel.

This article is a part of an “AI in …” series that shares information about AI in various industries and business functions. Be on the lookout for future (and past) articles in the series.

Thanks for reading and good luck on your data (AI) journey!

Other “AI in …” articles in the series:

AI in Hospitality

Choosing the Right Chart to display your data in Power BI or any other analytics tool

Data visualization is at the heart of analytics. Choosing the right chart or visual can make the difference between insights that are clear and actionable, and insights that remain hidden. There are many visualization types available for showcasing your data, and choosing the right ones for your use cases is important. Below, we’ll walk through some common scenarios and share information on the charts best suited for them, and will also touch on some Power BI–specific visuals you should know about.

1. Showing Trends Over Time

When to use: To track how a measure changes over days, months, or years.

Best charts:

  • Line Chart: The classic choice for time series data. Best when you want to show continuous change. In Power BI, the line chart visual can also be used for forecasting trends.
  • Area Chart: Like a line chart but emphasizes volume under the curve—great for cumulative values or when you want to highlight magnitude.
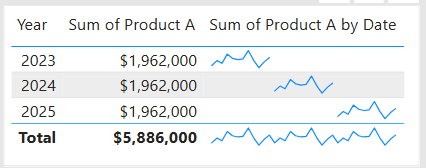
  • Sparklines (Power BI): Miniature line charts embedded in tables or matrices. Ideal for giving quick context without taking up space.

2. Comparing Categories

When to use: To compare values across distinct groups (e.g., sales by region, revenue by product).

Best charts:

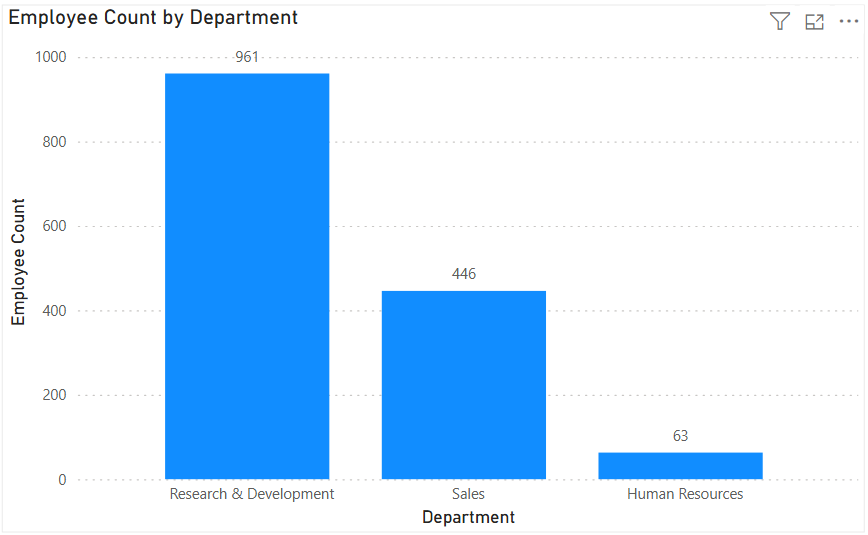
  • Column Chart: Vertical bars for category comparisons. Good when categories are on the horizontal axis.
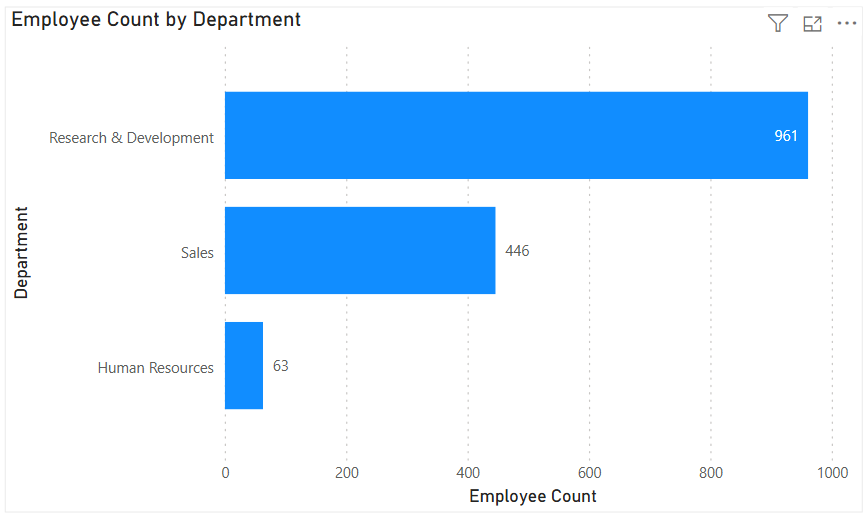
  • Bar Chart: Horizontal bars—useful when category names are long or when ranking items. Is usually a better choice than the column chart when there are many values.
  • Stacked Column/Bar Chart: Show category totals and subcategories in one view. Works for proportional breakdowns, but can get hard to compare across categories.

3. Understanding Relationships

When to use: To see whether two measures are related (e.g., advertising spend vs. sales revenue).

Best charts:

  • Scatter Chart: Plots data points across two axes. Useful for correlation analysis. Add a third variable with bubble size or color to generate more insights. This chart can also be useful for identifying anomalies/outliers in the data.
  • Line & Scatter Combination: Power BI lets you overlay a line for trend direction while keeping the scatter points.
  • Line & Bar/Column Chart Combination: Power BI offers some of these combination charts also to allow you to relate your comparison measures to your trend measures.

4. Highlighting Key Metrics

Sometimes you don’t need a chart—you just want a single number to stand out. These types of visuals are great for high-level executive dashboards, or for the summary page of dashboards in general.

Best visuals in Power BI:

  • Card Visual: Displays one value clearly, like Total Sales.
  • KPI Visual: Adds target context and status indicator (e.g., actual vs. goal).
  • Gauge Visual: Circular representation of progress toward a goal—best for showing percentages or progress to target. For example, Performance Rating score shown on the scale of the goal.

5. Distribution Analysis

When to use: To see how data is spread across categories or ranges.

Best charts:

  • Column/Bar Chart with bins: Useful for creating histograms in Power BI.
  • Box-and-Whisker Chart (custom visual): Shows median, quartiles, and outliers.
  • Pie/Donut Charts: While often overused, they can be effective for showing composition when categories are few (ideally 3–5). For example, show the number and percentage of employees in each department.

6. Spotting Problem Areas

When to use: To identify anomalies or areas needing attention across a large dataset.

Best charts:

  • Heatmap: A table where color intensity represents value magnitude. Excellent for finding hot spots or gaps. This can be implemented in Power BI by using a Matrix visual with conditional formatting in Power BI.
  • Treemap: Breaks data into rectangles sized by value—helpful for hierarchical comparisons and for easily identifying the major components of the whole.

7. Detail-Level Exploration

When to use: To dive into raw data while keeping formatting and hierarchy.

Best visuals:

  • Table: Shows granular row-level data. Best for detail reporting.
  • Matrix: Adds pivot-table–like functionality with rows, columns, and drill-down. Often combined with conditional formatting and sparklines for added insight.

8. Part-to-Whole Analysis

When to use: To see how individual parts contribute to a total.

Best charts:

  • Stacked Charts: Show both totals and category breakdowns.
  • 100% Stacked Charts: Normalize totals so comparisons are by percentage share.
  • Treemap: Visualizes hierarchical data contributions in space-efficient blocks.

Quick Reference: Which Chart to Use?

ScenarioBest Visuals
Tracking trends, forecasting trendsLine, Area, Sparklines
Comparing categoriesColumn, Bar, Stacked
Showing relationshipsScatter, Line + Scatter, Line + Column/Bar
Highlighting metricsCard, KPI, Gauge
Analyzing distributionsHistogram (columns with bins), Box & Whisker, Pie/Donut (for few categories)
Identifying problem areasHeatmap (Matrix with colors), Treemap, Scatter
Exploring detail dataTable, Matrix
Showing part-to-wholeStacked Column/Bar, 100% Stacked, Treemap, Pie/Donut

The below graphic shows the visualization types available in Power BI. You can also import additional visuals by clicking the “3-dots” (get more visuals) at the bottom of the visualization icons.

Summary

Power BI, and other BI/analytics tools, offers a rich set of visuals, each designed to represent data in a way that suits a specific set of analytical needs. The key is to match the chart type with the story you want the data to tell. Whether you’re showing a simple KPI, uncovering trends, or surfacing problem areas, choosing the right chart ensures your insights are clear, actionable, and impactful. In addition, based on your scenario, it can also be beneficial to get feedback from the user population on what other visuals they might find useful or what other ways they would they like to see the data.

Thanks for reading! And good luck on your data journey!