Learning Hadoop: The benefits of Hadoop commercial distributions

What are the benefits of using a commercial distribution of Hadoop? And what are the popular commercial distributions of Hadoop?

Hadoop, the preeminent open-source platform for retrieving, processing, storing and analyzing very large amounts of data, has grown tremendously from its core components pioneered by Google into a powerful ecosystem of supporting tools. There are various tools for integrating, streaming, storing, searching, and retrieving data, and tools for security and resource management, among others. And new tools keep emerging at a rapid pace.

Keeping these tools in sync with the versions that are compatible with each other, and keeping patches up-to-date, and plugging in new tools as they become available, and making sure it all works well together, along with the normal management of the Hadoop cluster, can become overwhelming for a small team. Using a commercial distribution of Hadoop alleviates this problem.

Commercial Distributions of Hadoop bundle the various tools of the ecosystem using compatible versions, ensure that they all work together, apply patches, package things in a way that makes the distribution of the software easy to download and install, and provide tools for managing the platform. For production projects created to help meet important business goals, it’s best to use a commercial distribution instead of trying to handle it all on your own. This will allow your team more time to focus on building business solutions instead of solving pesky technology issues.

Some of the most popular commercial distributions of Hadoop (not in any specific order) are:

  • Cloudera Hadoop Distribution (CDH)
    • Some major technology vendors, such as Oracle and Dell, provide their flavors of CDH
  • Hortonworks Data Platform (HDP)
  • Amazon Elastic MapReduce
  • MapR Hadoop Distribution
  • IBM Open Platform
  • Microsoft Azure’s HDInsight
  • Pivotal Big Data Suite
  • Datameer Professional
  • Datastax Enterprise Analytics

I will provide details of the various distributions in future posts.

Learning Hadoop: The key features and benefits of Hadoop

What are the key features and benefits of Hadoop? Why is Hadoop such a successful platform?

Apache Hadoop, mostly called just Hadoop, is a software framework and platform for reading, processing, storing and analyzing very large amounts of data. There are several features of Hadoop that make it a very powerful solution for data analytics.

Hadoop is Distributed

With Hadoop, from a few to hundreds or thousands of commodity servers (called nodes) can be connected (forming a cluster) to work together to achieve whatever processing power and storage capability is needed. The software platform enables the nodes to work together, passing work and data between them. Data and processing is distributed across nodes which spreads the load and significantly reduces the impact of failure.

Hadoop is Scalable

In the past, to achieve extremely powerful computing, a company would have to buy very expensive, large, monolithic computers. As data growth exploded, eventually even those super computers would become insufficient. With Hadoop, from a few to hundreds or thousands or even millions of commodity servers can be relatively easily connected to work together to achieve whatever processing power and storage capability is needed. This allows a company or project to start out small and then grow as needed inexpensively, without any concern about hitting a limitation.

Hadoop is Fault Tolerant

Hadoop was designed and built around the fact that there will be frequent failures on the commodity hardware servers that make up the Hadoop cluster. When a failure occurs, the software handles the automatic reassignment of work and replication of data to other nodes in the cluster, and the system continues to function properly without manual intervention. When a node recovers, from a reboot for example, it will rejoin the cluster automatically and become available for work.

Hadoop is backed by the power of Open Source

Hadoop is open source software, which means that it can be downloaded, installed, used and even modified for free. It is managed by the renown non-profit group, Apache Software Foundation (ASF), hence the name Apache Hadoop. The group is made up of many brilliant people from all over the world, many of whom work at some of the top technology companies, who commit their time to managing the software. In addition, there are also many developers that contribute code to enhance or add new features and functionality to Hadoop or to add new tools that work with Hadoop. The various tools that have been built over the years to complement core Hadoop make up what is called the Hadoop ecosystem. With a large community of people from all over the world continuously adding to the growth of the Hadoop ecosystem in a well-managed way, it will only get better and become more useful to many more use-cases.

These are the reasons Hadoop has become such a force within the data world. Although there is some hype around the big data phenomenon, the benefits and solutions based on the Hadoop ecosystem are real.

You can learn more at https://hadoop.apache.org

Connecting to Microsoft SQL Server database from Oracle SQL Developer

If you work primarily with Oracle databases, you may use SQL Developer. But you may also need to connect to Microsoft SQL Server databases and not necessarily want to install a new front-end database tool, such as Microsoft SQL Server Management Studio (SSMS).  You can connect to SQL Server from SQL Developer.

First, download the appropriate JDBC Driver for the version of SQL Server that you need to connect to. Then follow the steps in the video at the link below on the Oracle website.

https://www.oracle.com/technetwork/developer-tools/sql-developer/sql-server-connection-viewlet-swf-089886.html

Good luck.


Error downloading data to Excel in OBIEE 12c

If you get the error …

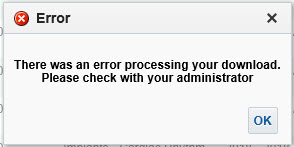
“There was an error processing your download. Please check with your administrator.”

… when Exporting / Downloading data from an analysis in OBIEE, then this post might be helpful.

In OBIEE, you have a few options for exporting / downloading data from an analysis / report as shown below. You can export / download to PDF, Excel 2007+, PowerPoint 2007+, Web Archive (.mht), or in CSV, Tab Delimited, or XML data formats.

OBIEE_Export_Analysis_Data

If you are trying to download data from an analysis and get this error …

OBIEE_Export_to_Excel_Failed

“There was an error processing your download. Please check with your administrator.”
then try the following fix. Note, you might find that you are able to download to CSV, but get the error when you try to download to Excel.

Edit the config.xml file
Located at the directory specified below (for OBIEE 12c):
ORACLE_HOME/user_projects/domains/bi/config/fmwconfig/biconfig/OBIJH

FYI, this is the location of the config.xml file in OBIEE 11g
[MW_HOME]/instances/instance1/config/OracleBIJavaHostComponent/coreapplication_obijh1

Locate the section and the parameter within that section. It may look like below, but there could be more or less parameters within the section than shown here.

<XMLP>
<InputStreamLimitInKB>8192</InputStreamLimitInKB>
<ReadRequestBeforeProcessing>true</ReadRequestBeforeProcessing>
</XMLP>

Change the value of the InputStreamLimitInKB parameter to 0 as shown below…

<XMLP>
<InputStreamLimitInKB>0</InputStreamLimitInKB>
<ReadRequestBeforeProcessing>true</ReadRequestBeforeProcessing>
</XMLP>

Restart the OBIEE services and try your export again.

If it succeeds, then we know for sure that altering this parameter fixes it.
Setting the above parameter value to zero (0) means that there is no limit. So, you may now go back and modify the value to a number that is suitable for your environment, such as, 8192, 15384, 65536, etc.

Error on reports after upgrading to OBIEE 12.2.1.1.0 – “nQSError 35029: Unable to evaluate text 0.0 as either true or false”

After upgrading or migrating to OBIEE 12.2.1.1.0, you may encounter this error: “nQSError 35029: Unable to evaluate text 0.0 as either true or false”.
This is a known bug and there is a patch for it.

The Bug # is: 24005980
And the Patch # and description is: 24005980 – RPD CONSISTENCY ERRORS AFTER UPGRADE FROM 12.2.1.0.0 TO 12.2.1.1.0.

Applying this patch resolved the issue for us.

Good luck with your resolution.

InfatoODI – Informatica to ODI conversion tool

We are currently in the process of upgrading Oracle Business Intelligence Applications (OBIA) from version 7.9.6 to OBIA 11g.  Oracle has replaced Informatica as the data integration tool in the platform with it’s own tool, Oracle Data Integrator (ODI). This was a selfish, profit-driven move on Oracle’s part with no consideration for the impact on customers, but it is what it is.

Because of this, as a part of the upgrade to the new OBIA release, we need to convert all our hundreds of Informatica mappings to ODI.  As you can imagine, this is a lot of work.  We are getting help from a company that has developed a specialized conversion tool called InfatoODI, which converts Informatica mappings to ODI interfaces.

We are performing the conversions specifically for an OBIA application, but the tool can be used as a straight conversion tool for Informatica-to-ODI for any type of application.

We are in the beginning stages of the project, but early indications are that the tool will save us time, but I am not sure how significant as yet. I will post updates as we progress through the conversions with my experience and opinion of the tool.

Oracle Data Integrator (ODI) Knowledge Modules (KMs)

I am currently working on a project to upgrade (Oracle Business Intelligence Applications) OBIA 7 to OBIA 11g.  OBIA 11g and all future releases of OBIA (per Oracle) will use Oracle Data Integrator (ODI) as the ETL platform, replacing Informatica.

Due to this, I need to become very familiar with ODI to be able to manage and support the new release, and will be writing about ODI from time to time.

One key component in ODI is Knowledge Modules (KM’s).  In this post, I will describe what Knowledge Modules are and the various types that are in ODI.

Knowledge Modules (KMs) are generic code templates or modules that can be configured/coded to meet specific data integration needs and each type is dedicated to a specialized function in the overall data integration process.

Each of the 6 out-of-the-box (OOB) Knowledge Modules contain the “knowledge” to perform a specific set of actions on a specific combination of technologies, including connecting, extracting, transforming, loading, and checking data.  While the 6 OOB KMs meet most data integration needs, there will surely be cases when more custom features are needed. ODI KMs are extensible, and new totally custom KMs can be built.

The 6 OOB KMs are:

Reverse Knowledge Module (RKM)
This KM is used to retrieve metadata from data sources and targets to the Oracle Data Integrator work repository. You can use it in models to perform customized reverse-engineering.

Loading Knowledge Module (LKM)
This KM is used to load heterogeneous data to a staging area. It is used in interfaces with heterogeneous sources. The LKM and the IKM are the two most frequently used KM’s in our environment.

Journalizing Knowledge Module (JKM)
This KM is used in models, sub models and databases to create, start and stop journals and to register subscribers. It creates the Change Data Capture framework objects in the source staging area.

Integration Knowledge Module (IKM)
This KM is used in Interfaces to integrate data from the staging area to a target. The LKM and the IKM are probably the two most frequently used KM’s in our environment.

Check Knowledge Module (CKM)
This KM is used to perform consistency checks of data against defined constraints. It is used in models, sub models and databases for data integrity audit, and used in interfaces for flow control or static control.

Service Knowledge Module (SKM)
This KM is used in models and databases. It is used to generate data manipulation web services.

These KM’s are central to ODI and I will need to master the usage of these KM’s and if you are planning on using ODI, you will need to also.

OBIEE 11g vs OBIEE 12c – What’s new in OBIEE 12c

In this post I highlight a few of the new features of OBIEE 12c, and in some cases show how they differ from OBIEE 11g.

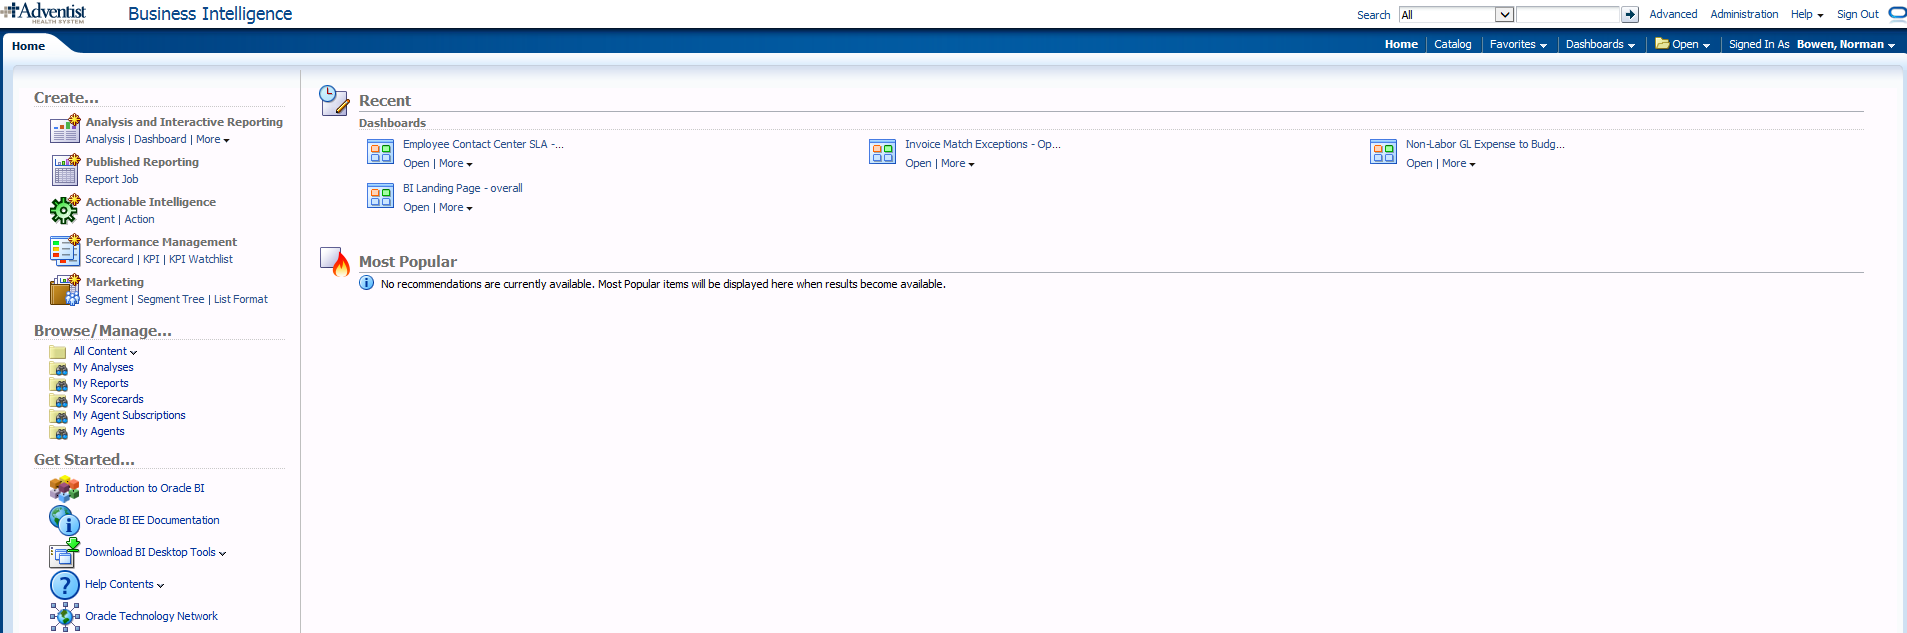
The OBIEE Home Page looks a bit different, and includes a new “Data Exploration & Discovery” option and functionality.

OBIEE 11g
Whats_new_OBIEE12c_OBIEE_11g_HomePage

OBIEE 12c
Whats_new_OBIEE12c_OBIEE_12c_HomePage

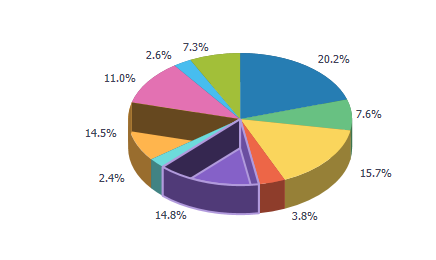
OBIEE 12c has a new visualization feature:  Mouse-over highlights the selected area with animation.

For example, the below image shows what it looks like when you mouse-over the “14.8% purple” slice.

Note: In reports where the selection drills on the entire stacked column (such as in a vertical stacked graph), the drilling will operate the same as before – that is – if the drill was done on the selected area only in 11g, then that will continue to occur; If the report was drilling on the entire stack/column when clicked in 11g, that will continue to occur also (even though the animation only happens on the area that was clicked).

Whats_new_OBIEE12c_new_visualization_feature

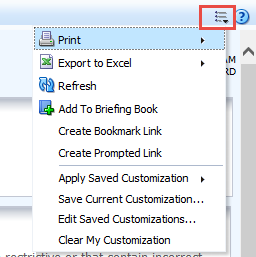
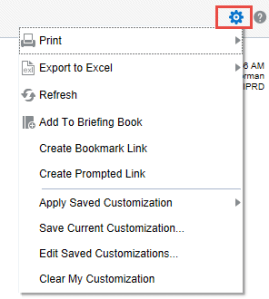
The Dashboard “Page Options” icon has changed from the “3 lines with the down arrow” to a “gear” icon.

OBIEE 11g
Whats_new_OBIEE12c_Dashboard_Page_Options_11g

OBIEE 12c
Whats_new_OBIEE12c_Dashboard_Page_Options_12c

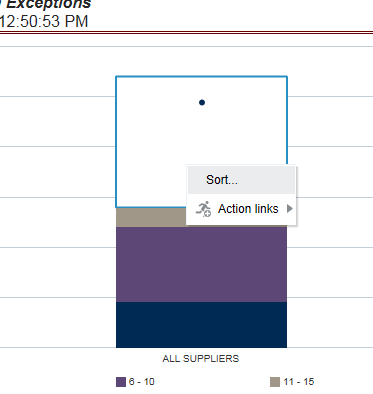
OBIEE 12c now provides the ability to Sort in graphs by right-clicking and using the pop-up menu. So, you will now see the Sort option along with the Action Links when you right-click on a graph.

Whats_new_OBIEE12c_Sort_in_Graphs

For report developers:

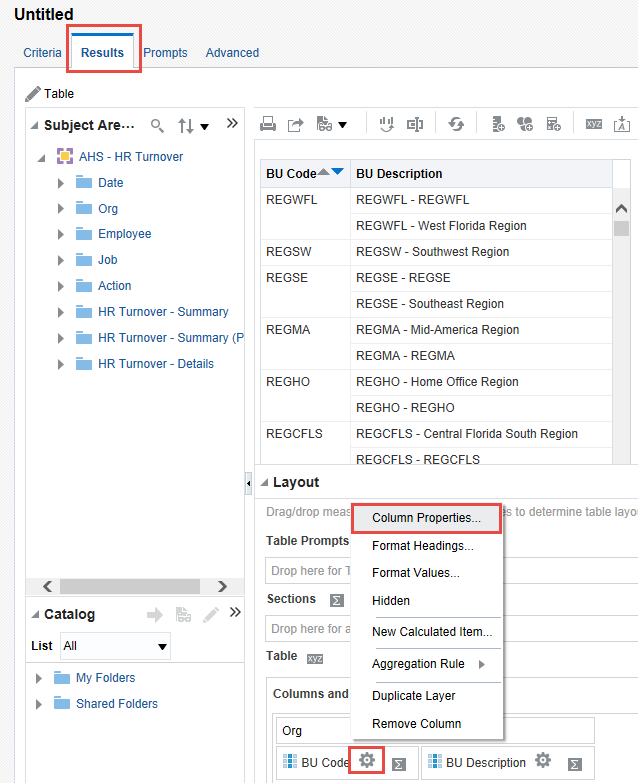
In OBIEE 12c: It is now possible to modify Column Properties from the Results tab – more efficient.

Whats_new_OBIEE12c_modify_column_properties

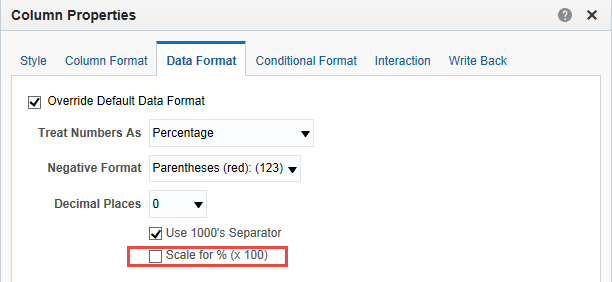
In OBIEE 12c: There is a new “Scale for % (x 100)” option in the Column Properties – Data Format tab.

Whats_new_OBIEE12c_new_scale_in_column_properties

In OBIEE 12c: You can create a new Calculated Column in the Results tab by clicking the “ruler” icon.

Whats_new_OBIEE12c_new_calculated_column

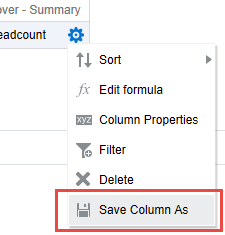
After adding the column, use the new “Save Column As” option to save the column. This is great feature that will allow for re-using calculated columns instead of having to re-enter the formula each time.

Whats_new_OBIEE12c_Save_Column_As

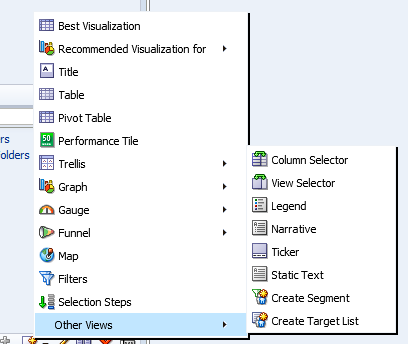
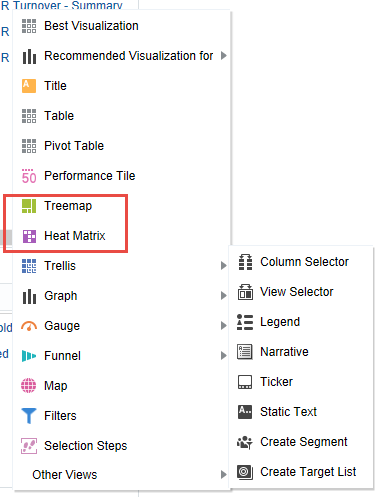
OBIEE 12c introduces 2 new visualization options – Tree Map and Heat Index

OBIEE 11g
Whats_new_OBIEE12c_Vizualization_options_11g

OBIEE 12c
Whats_new_OBIEE12c_Vizualization_options_12c

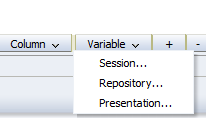
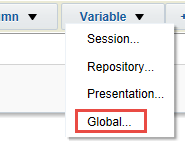
OBIEE 12c introduces a new Global Variable type, that can be a value or an expression.

OBIEE 11g  Whats_new_OBIEE12c_Variable_Types_11g                OBIEE 12c Whats_new_OBIEE12c_Variable_Types_12c

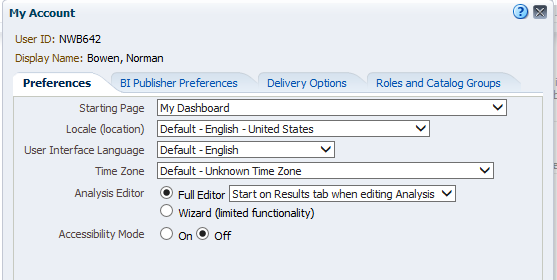
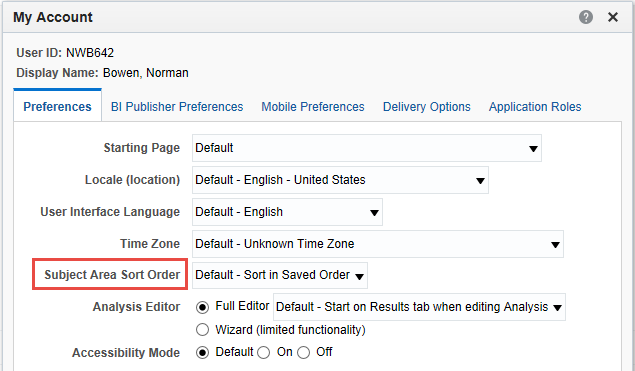
In OBIEE 12c, there is a new “Subject Area Sort Order” option available in Account properties.

OBIEE 11g
Whats_new_OBIEE12c_Account_Properties_11g

OBIEE 12c
Whats_new_OBIEE12c_Account_Properties_12c

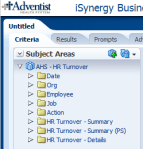
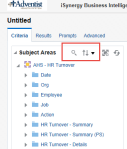
OBIEE 12c provides the ability to search a subject area by keyword entered, and to sort folders and columns in a subject area.

OBIEE11g  Whats_new_OBIEE12c_Subject_Areas_11g                OBIEE 12c Whats_new_OBIEE12c_Subject_Areas_12c

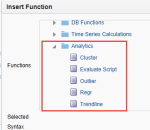
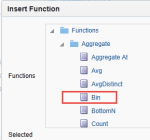
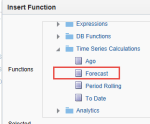
In OBIEE 12c, there are a few new analytic functions.  A new Analytics folder contains new functions Cluster, Evaluate Script, Outlier, Regr, and Trendline. The Aggregate folder contains a new function, Bin. And the Time Series Calculations folder contains a new function, Forecast.

Whats_new_OBIEE12c_New_Analytic_Functions_12c_1          Whats_new_OBIEE12c_New_Analytic_Functions_12c_2          Whats_new_OBIEE12c_New_Analytic_Functions_12c_3

Creating a Business Intelligence (BI) & Analytics Strategy and Roadmap

This post provides some of my thoughts on how to go about creating a Business Intelligence (BI) & Analytics Strategy and Roadmap for your client or company.  Please comment with your suggestions from your experience for improving this information.


When creating or updating the BI & Analytics Strategy and Roadmap for a company, one of the first things to understand is:

Who are all the critical stakeholders that need to be involved?

Understanding who needs and uses the BI & Analytics systems is critical for starting the process of understanding and documenting the “who needs what, why, and when”.

These are some of the roles that are typically important stakeholders:

  • High-level business executives that are paying for the projects
  • Business directors involved in the usage of the systems
  • IT directors involved in the developing and support of the systems
  • Business Subject Matter Experts (SME’s) & Business Analysts
  • BI/Analytics/Data/System Architects
  • BI/Analytics/Data/System Developers and Administrators


Then, you need to ask all these stakeholders, especially those from the business:

What are the drivers for BI & Analytics? And what is the level of importance for each of these drivers?

This will help you to understand and document what business needs are creating the need for new or modified BI & Analytics solutions. You should then go deeper to understand … what are the business objectives and goals that are driving these business needs.  This will help you to understand and document the bigger picture so that a more comprehensive strategy and roadmap can be created.

The questions and discussions surrounding the above will require deep and broad business involvement. Getting the perspective of a wide range of users from all business areas that are using the BI & Analytics Systems is critical.  The business should be involved throughout the process of creating the strategy and roadmap, and all decisions should tie back to support for business objectives and goals. And the trail leading to all these decisions must be documented.

Some examples of business drivers include:

  • Gain more insight into who our best customers are and how best to acquire them.
  • Understand how weather affects our sales/revenue.
  • Determine how we can sell more to our existing customers.
  • Understand what causes employee turnover.
  • Gain insight into how we can improve staffing schedules.


And examples of business objectives and goals may include things like:

  • Increase corporate revenues by 10%
  • Grow our base of recurring customers
  • Stabilize corporate revenues over all seasons
  • Create an environment where employees love to work
  • Reduce payroll costs without a reduction in staff, for example, reduce turnover.


Then, turn to understanding and documenting the current scenario (if not already known). Identify what systems (including data sources) are in place, who are using them (and why and how), what capabilities do they offer, what are the must-haves, and what are the pain points and positive highlights.

Also, you will need to determine the current workload (and future workload if it can be determined) of the primary team members involved in developing, testing, and implementing BI & Analytics solutions.

This will help you understand a few things:

  • Some of the highest priority needs of the users
  • Gaps in capabilities and data between what is needed and what is currently in place (including an understanding of what is liked and disliked about the current systems)
  • Current user base knowledge and engagement
  • IT knowledge and skills
  • Resource availability – when are people available to work on new initiatives


What are the options and limitations?

  • Can existing systems be customized to meet the requirements?
  • Can they be upgraded to a new version that has the needed functionality?
  • Do we need to consider adding a new platform or replacing one or more of the existing systems with a new platform?
  • Can we migrate from/integrate one system to/with another system that we already have up and running?
  • Are any of our current systems losing vendor support or require an upgrade for other reasons? Has the pricing changed for any of our software applications?
  • What options does our budget permit us to explore?
  • What options do our knowledge and skills permit us to explore?


Once you have identified these items …

  • Identify and engage stakeholders, and document these roles and the people
  • Identify and document business drivers, objectives and goals
  • Understand and document the current landscape – needs (including must-haves), technology, gaps, users, IT staff, resource availability, and more
  • Identify and document options – based on current landscape, technology, budget, staff resources, etc.

… you can develop a “living” Strategy and Roadmap for BI & Analytics. And when I say “living”, I mean it will not be a static document, but will be fine-tuned over time as new information emerge and as changes arise in business needs, technology, and staff resources.


Your Strategy and Roadmap for BI & Analytics should include, but is not limited to:

  • BI & Analytics that will be used to satisfy business drivers, objectives and goals
  • Data acquisition and storage plan for meeting the analytics needs
  • Technology platforms that will be used to process and store data, and deliver the analytics
  • Information about any new technologies that needs to be acquired or implemented, and schedules
  • Roles and Responsibilities for all stakeholders involved in BI & Analytics projects
  • Planned staffing allocations and schedules
  • Planned staffing changes and schedules
  • User training (business users) and Delivery team training (technical implementers & developers for example)
  • List dependencies for each item or set of items