Category: SQL

Merge or Join Data

This post is a part of the DP-600: Implementing Analytics Solutions Using Microsoft Fabric Exam Prep Hub; and this topic falls under these sections: 
Prepare data
--> Transform data
--> Merge or join data

Merging or joining data is a fundamental transformation task in Microsoft Fabric. It enables you to combine related data from multiple tables or sources into a single dataset for analysis, modeling, or reporting. This skill is essential for preparing clean, well-structured data in lakehouses, warehouses, dataflows, and Power BI semantic models.

For the DP-600 exam, you are expected to understand when, where, and how to merge or join data using the appropriate Fabric tools, as well as the implications for performance, data quality, and modeling.

Merge vs. Join: Key Distinction

Although often used interchangeably, the terms have slightly different meanings depending on the tool:

  • Merge
    • Commonly used in Power Query
    • Combines tables by matching rows based on one or more key columns
    • Produces a new column that can be expanded
  • Join
    • Commonly used in SQL and Spark
    • Combines tables using explicit join logic (JOIN clauses)
    • Output schema is defined directly in the query

Where Merging and Joining Occur in Fabric

Fabric ExperienceHow It’s Done
Power Query (Dataflows Gen2, Lakehouse)Merge Queries UI
WarehouseSQL JOIN statements
Lakehouse (Spark notebooks)DataFrame joins
Power BI DesktopPower Query merges

Common Join Types (Exam-Critical)

Understanding join types is heavily tested:

  • Inner Join
    • Returns only matching rows from both tables
  • Left Outer Join
    • Returns all rows from the left table and matching rows from the right
  • Right Outer Join
    • Returns all rows from the right table and matching rows from the left
  • Full Outer Join
    • Returns all rows from both tables
  • Left Anti / Right Anti Join
    • Returns rows with no match in the other table

👉 Exam tip: Anti joins are commonly used to identify missing or unmatched data.

Join Keys and Data Quality Considerations

Before merging or joining data, it’s critical to ensure:

  • Join columns:
    • Have matching data types
    • Are cleaned and standardized
    • Represent the same business entity
  • Duplicate values in join keys can:
    • Create unexpected row multiplication
    • Impact aggregations and performance

Performance and Design Considerations

  • Prefer SQL joins or Spark joins for large datasets rather than Power Query
  • Filter and clean data before joining to reduce data volume
  • In dimensional modeling:
    • Fact tables typically join to dimension tables using left joins
  • Avoid unnecessary joins in the semantic layer when they can be handled upstream

Common Use Cases

  • Combining fact data with descriptive attributes
  • Enriching transactional data with reference or lookup tables
  • Building dimension tables for star schema models
  • Validating data completeness using anti joins

Exam Tips and Pitfalls

  • Don’t confuse merge vs. append (append stacks rows vertically)
  • Know which tool to use based on:
    • Data size
    • Refresh frequency
    • Complexity
  • Expect scenario questions asking:
    • Which join type to use
    • Where the join should occur in the architecture

Key Takeaways

  • Merging and joining data is essential for data preparation in Fabric
  • Different Fabric experiences offer different ways to join data
  • Correct join type and clean join keys are critical for accuracy
  • Performance and modeling best practices matter for the DP-600 exam

Practice Questions:

Here are 10 questions to test and help solidify your learning and knowledge. As you review these and other questions in your preparation, make sure to …

  • Identifying and understand why an option is correct (or incorrect) — not just which one
  • Look for and understand the usage scenario of keywords in exam questions to guide you
  • Expect scenario-based questions rather than direct definitions

Question 1

What is the primary purpose of merging or joining data in Microsoft Fabric?

A. To reduce storage costs
B. To vertically stack tables
C. To combine related data based on a common key
D. To encrypt sensitive columns

✅ Correct Answer: C

Explanation:
Merging or joining data combines related datasets horizontally using shared key columns so that related attributes appear in a single dataset.

Question 2

In Power Query, what is the result of a Merge Queries operation?

A. Rows from both tables are appended
B. A new table is automatically created
C. A new column containing related table data is added
D. A relationship is created in the semantic model

✅ Correct Answer: C

Explanation:
Power Query merges add a column that contains matching rows from the second table, which can then be expanded.

Question 3

Which join type returns only rows that exist in both tables?

A. Left outer join
B. Right outer join
C. Full outer join
D. Inner join

✅ Correct Answer: D

Explanation:
An inner join returns only rows with matching keys in both tables.

Question 4

You want to keep all rows from a fact table and bring in matching dimension attributes. Which join type should you use?

A. Inner join
B. Left outer join
C. Right outer join
D. Full outer join

✅ Correct Answer: B

Explanation:
A left outer join preserves all rows from the left (fact) table while bringing in matching rows from the dimension table.

Question 5

Which join type is most useful for identifying records that do not have a match in another table?

A. Inner join
B. Full outer join
C. Left anti join
D. Right outer join

✅ Correct Answer: C

Explanation:
A left anti join returns rows from the left table that do not have matching rows in the right table, making it ideal for data quality checks.

Question 6

What issue can occur when joining tables that contain duplicate values in the join key?

A. Data type conversion errors
B. Row multiplication
C. Data loss
D. Query failure

✅ Correct Answer: B

Explanation:
Duplicate keys can cause one-to-many or many-to-many matches, resulting in more rows than expected after the join.

Question 7

Which Fabric experience is best suited for performing joins on very large datasets?

A. Power BI Desktop
B. Power Query
C. Warehouse using SQL
D. Excel

✅ Correct Answer: C

Explanation:
SQL joins in a warehouse are optimized for large-scale data processing and typically outperform Power Query for large datasets.

Question 8

Which operation should not be confused with merging or joining data?

A. Append
B. Inner join
C. Left join
D. Anti join

✅ Correct Answer: A

Explanation:
Append stacks tables vertically (row-wise), while merges and joins combine tables horizontally (column-wise).

Question 9

What should you verify before merging two tables?

A. That both tables have the same number of rows
B. That join columns use compatible data types
C. That all columns are indexed
D. That the tables are in the same workspace

✅ Correct Answer: B

Explanation:
Join columns must have compatible data types and clean values; otherwise, matches may fail or produce incorrect results.

Question 10

From a modeling best-practice perspective, where should complex joins ideally be performed?

A. In Power BI visuals
B. In DAX measures
C. Upstream in lakehouse or warehouse transformations
D. At query time in reports

✅ Correct Answer: C

Explanation:
Performing joins upstream simplifies semantic models, improves performance, and ensures consistency across reports.

Aggregate Data

This post is a part of the DP-600: Implementing Analytics Solutions Using Microsoft Fabric Exam Prep Hub; and this topic falls under these sections: 
Prepare data
--> Transform data
--> Aggregate data

Aggregating data is a foundational data transformation technique used to compute summaries and roll-ups, such as totals, averages, counts, and other statistical measures. In analytics solutions—even ones built in Microsoft Fabric—aggregation enables faster performance, simplified reporting, and clearer insights.

In the context of DP-600, you should understand why and when to aggregate data, how aggregation affects downstream analytics, and where it is implemented in Fabric workloads.

What Is Data Aggregation?

Aggregation refers to the process of summarizing detailed records into higher-level metrics. Common aggregation operations include:

  • SUM – total of a numeric field
  • COUNT / COUNT DISTINCT – number of records or unique values
  • AVG – average
  • MIN / MAX – lowest or highest value
  • GROUP BY – group records before applying aggregate functions

Aggregation turns row-level data into summary tables that are ideal for dashboards, KPIs, and trend analysis.

Why Aggregate Data?

Performance

Large detailed tables can be slow to query. Pre-aggregated data:

  • Reduces data scanned at query time
  • Improves report responsiveness

Simplicity

Aggregated data simplifies reporting logic for end users by providing ready-to-use summary metrics.

Consistency

When aggregations are standardized at the data layer, multiple reports can reuse the same durable summaries, ensuring consistent results.

When to Aggregate

Consider aggregating when:

  • Working with large detail tables (e.g., web logs, transaction history)
  • Reports require summary metrics (e.g., monthly totals, regional averages)
  • Users frequently query the same roll-ups
  • You want to offload compute from the semantic model or report layer

Where to Aggregate in Microsoft Fabric

Lakehouse

  • Use Spark SQL or SQL analytics endpoints
  • Good for large-scale transformations on big data
  • Ideal for creating summarized tables

Warehouse

  • Use T-SQL for aggregations
  • Supports highly optimized analytical queries
  • Can store aggregated tables for BI performance

Dataflows Gen2

  • Use Power Query transformations to aggregate and produce curated tables
  • Fits well in ETL/ELT pipelines

Notebooks

  • Use Spark (PySpark or SQL) for advanced or complex aggregations

Semantic Models (DAX)

  • Create aggregated measures
  • Useful for scenarios when aggregation logic must be defined at analysis time

Common Aggregation Patterns

Rollups by Time

Aggregating by day, week, month, quarter, or year:

SELECT
  YEAR(OrderDate) AS Year,
  MONTH(OrderDate) AS Month,
  SUM(SalesAmount) AS TotalSales
FROM Sales
GROUP BY
  YEAR(OrderDate),
  MONTH(OrderDate);

Aggregations with Dimensions

Combining filters and groupings:

SELECT
  Region,
  ProductCategory,
  SUM(SalesAmount) AS TotalSales,
  COUNT(*) AS OrderCount
FROM Sales
GROUP BY
  Region,
  ProductCategory;

Aggregations vs. Detailed Tables

AspectDetailed TableAggregated Table
Query flexibilityHighLower (fixed aggregates)
PerformanceLowerHigher
StorageModerateLower
BI simplicityModerateHigh

Best practice: store both detail and aggregated tables when storage and refresh times permit.

Aggregation and Semantic Models

Semantic models often benefit from pre-aggregated tables:

  • Improves report performance
  • Reduces row scans on large datasets
  • Can support composite models that combine aggregated tables with detail tables

Within semantic models:

  • Calculated measures define aggregation rules
  • Aggregated physical tables can be imported for performance

Governance and Refresh Considerations

  • Aggregated tables must be refreshed on a schedule that matches business needs.
  • Use pipelines or automation to update aggregated data regularly.
  • Ensure consistency between fact detail and aggregated summaries.
  • Document and version aggregation logic for maintainability.

Example Use Cases

Sales KPI Dashboard

  • Monthly total sales
  • Year-to-date sales
  • Average order value

Operational Reporting

  • Daily website visits by category
  • Hourly orders processed per store

Executive Scorecards

  • Quarter-to-date profits
  • Customer acquisition counts by region

Best Practices for DP-600

  • Aggregate as close to the data source as practical to improve performance
  • Use Dataflows Gen2, Lakehouse SQL, or Warehouse SQL for durable aggregated tables
  • Avoid over-aggregation that removes necessary detail for other reports
  • Use semantic model measures for dynamic aggregation needs

Key Takeaway
In DP-600 scenarios, aggregating data is about preparing analytics-ready datasets that improve performance and simplify reporting. Understand how to choose the right place and method for aggregation—whether in a lakehouse, warehouse, dataflow, or semantic model—and how that choice impacts downstream analytics.

Practice Questions:

Here are 10 questions to test and help solidify your learning and knowledge. As you review these and other questions in your preparation, make sure to …

  • Identifying and understand why an option is correct (or incorrect) — not just which one
  • Look for and understand the usage scenario of keywords in exam questions to guide you
  • Expect scenario-based questions rather than direct definitions

Question 1

What is the primary purpose of aggregating data in analytics solutions?

A. To increase data granularity
B. To reduce data quality issues
C. To summarize detailed data into meaningful metrics
D. To enforce security rules

✅ Correct Answer: C

Explanation:
Aggregation summarizes detailed records (for example, transactions) into higher-level metrics such as totals, averages, or counts, making data easier to analyze and faster to query.

Question 2

Which SQL clause is required when using aggregate functions like SUM() or COUNT() with non-aggregated columns?

A. ORDER BY
B. GROUP BY
C. WHERE
D. HAVING

✅ Correct Answer: B

Explanation:
GROUP BY defines how rows are grouped before aggregate functions are applied. Any non-aggregated column in the SELECT clause must appear in the GROUP BY clause.

Question 3

Which scenario is the best candidate for creating a pre-aggregated table in Microsoft Fabric?

A. Ad-hoc exploratory analysis
B. Frequently queried KPIs used across multiple reports
C. Data with unpredictable schema changes
D. Small lookup tables

✅ Correct Answer: B

Explanation:
Pre-aggregated tables are ideal for commonly used KPIs because they improve performance and ensure consistent results across reports.

Question 4

Where can durable aggregated tables be created in Microsoft Fabric?

A. Only in semantic models
B. Only in notebooks
C. Lakehouses and warehouses
D. Power BI reports

✅ Correct Answer: C

Explanation:
Both Lakehouses (via Spark SQL or SQL analytics endpoints) and Warehouses (via T-SQL) support persistent aggregated tables.

Question 5

Which aggregation function returns the number of unique values in a column?

A. COUNT
B. SUM
C. AVG
D. COUNT DISTINCT

✅ Correct Answer: D

Explanation:
COUNT DISTINCT counts only unique values, which is commonly used for metrics like unique customers or unique orders.

Question 6

What is a key benefit of aggregating data before loading it into a semantic model?

A. Increased storage usage
B. Improved query performance
C. More complex DAX expressions
D. Higher data latency

✅ Correct Answer: B

Explanation:
Pre-aggregated data reduces the number of rows scanned at query time, resulting in faster report and dashboard performance.

Question 7

Which Fabric component is best suited for performing aggregation as part of an ETL or ELT process using Power Query?

A. Notebooks
B. Dataflows Gen2
C. Eventhouses
D. Semantic models

✅ Correct Answer: B

Explanation:
Dataflows Gen2 use Power Query and are designed for repeatable data transformations, including grouping and aggregating data.

Question 8

What is a common tradeoff when using aggregated tables instead of detailed fact tables?

A. Higher storage costs
B. Reduced data security
C. Loss of granular detail
D. Slower refresh times

✅ Correct Answer: C

Explanation:
Aggregated tables improve performance but reduce flexibility because detailed, row-level data is no longer available.

Question 9

Which aggregation pattern is commonly used for time-based analysis?

A. GROUP BY product category
B. GROUP BY customer ID
C. GROUP BY date, month, or year
D. GROUP BY transaction ID

✅ Correct Answer: C

Explanation:
Time-based aggregations (daily, monthly, yearly) are fundamental for trend analysis and KPI reporting.

Question 10

Which approach is considered a best practice when designing aggregated datasets for analytics?

A. Aggregate all data at the highest level only
B. Store only aggregated tables and discard detail data
C. Maintain both detailed and aggregated tables when possible
D. Avoid aggregations until the reporting layer

✅ Correct Answer: C

Explanation:
Keeping both detail-level and aggregated tables provides flexibility while still achieving strong performance for common analytical queries.

Implement a Star Schema for a Lakehouse or Warehouse

This post is a part of the DP-600: Implementing Analytics Solutions Using Microsoft Fabric Exam Prep Hub; and this topic falls under these sections: 
Prepare data
--> Transform data
--> Implement a star schema for a lakehouse or warehouse

Designing and implementing an effective schema is foundational to efficient analytics. In Microsoft Fabric, structuring your data into a star schema dramatically improves query performance, simplifies reporting, and aligns with best practices for BI workloads.

This article explains what a star schema is, why it matters in Fabric, and how to implement it in a lakehouse or data warehouse.

What Is a Star Schema?

A star schema is a relational modeling technique that organizes data into two primary types of tables:

  • Fact tables: Contain measurable, quantitative data (metrics, transactions, events).
  • Dimension tables: Contain descriptive attributes (e.g., customer info, product details, dates).

Star schemas get their name because the design resembles a star—a central fact table linked to multiple dimension tables.

Why Use a Star Schema?

A star schema offers multiple advantages for analytical workloads:

  • Improved query performance: Queries are simplified and optimized due to straightforward joins.
  • Simpler reporting: BI tools like Power BI map naturally to star schemas.
  • Aggregations and drill-downs: Dimension tables support filtering and hierarchy reporting.
  • Better scalability: Optimized for large datasets and parallel processing.

In Fabric, both lakehouses and warehouses support star schema implementations, depending on workload and user needs.

Core Components of a Star Schema

1. Fact Tables

Fact tables store the numeric measurements of business processes.
Common characteristics:

  • Contains keys linking to dimensions
  • Often large and wide
  • Used for aggregations (SUM, COUNT, AVG, etc.)

Examples:
Sales transactions, inventory movement, website events

2. Dimension Tables

Dimension tables describe contextual attributes.
Common characteristics:

  • Contain descriptive fields
  • Usually smaller than fact tables
  • Often used for filtering/grouping

Examples:
Customer, product, date, geography

Implementing a Star Schema in a Lakehouse

Lakehouses in Fabric support Delta format tables and both Spark SQL and T-SQL analytics endpoints.

Steps to Implement:

  1. Ingest raw data into your lakehouse (as files or staging tables).
  2. Transform data:
    • Cleanse and conform fields
    • Derive business keys
  3. Create dimension tables:
    • Deduplicate
    • Add descriptive attributes
  4. Create fact tables:
    • Join transactional data to dimension keys
    • Store numeric measures
  5. Optimize:
    • Partition and Z-ORDER for performance

Tools You Might Use:

  • Notebooks (PySpark)
  • Lakehouse SQL
  • Data pipelines

Exam Tip:
Lakehouses are ideal when you need flexibility, schema evolution, or combined batch + exploratory analytics.

Implementing a Star Schema in a Warehouse

Data warehouses in Fabric provide a SQL-optimized store designed for BI workloads.

Steps to Implement:

  1. Stage raw data in warehouse tables
  2. Build conforming dimension tables
  3. Build fact tables with proper keys
  4. Add constraints and indexes (as appropriate)
  5. Optimize with materialized views or aggregations

Warehouse advantages:

  • Strong query performance for BI
  • Native SQL analytics
  • Excellent integration with Power BI and semantic models

Exam Tip:
Choose a warehouse when your priority is high-performance BI analytics with well-defined dimensional models.

Common Star Schema Patterns

Conformed Dimensions

  • Dimensions shared across multiple fact tables
  • Ensures consistent filtering and reporting across business processes

Slowly Changing Dimensions (SCD)

  • Maintain historical attribute changes
  • Types include Type 1 (overwrite) and Type 2 (versioning)

Fact Table Grain

  • Define the “grain” (level of detail) clearly—for example, “one row per sales transaction.”

Star Schema and Power BI Semantic Models

Semantic models often sit on top of star schemas:

  • Fact tables become measure containers
  • Dimensions become filtering hierarchies
  • Reduces DAX complexity
  • Improves performance

Best Practice: Structure your lakehouse or warehouse into a star schema before building the semantic model.

Star Schema in Lakehouse vs Warehouse

FeatureLakehouseWarehouse
Query enginesSpark & SQLSQL only
Best forMixed workloads (big data + SQL)BI & reporting
OptimizationPartition/Z-ORDERIndexing and statistics
ToolingNotebooks, pipelinesSQL scripts, BI artifacts
Schema complexityFlexibleRigid

Governance and Performance Considerations

  • Use consistent keys across facts and dimensions
  • Validate referential integrity where possible
  • Avoid wide, unindexed tables for BI queries
  • Apply sensitivity labels on schemas for governance
  • Document schema and business logic

What to Know for the DP-600 Exam

Be prepared to:

  • Explain the purpose of star schema components
  • Identify when to implement star schema in lakehouses vs warehouses
  • Recognize patterns like conformed dimensions and SCDs
  • Understand performance implications of schema design
  • Relate star schema design to Power BI and semantic models

Final Exam Tip
If the question emphasizes high-performance reporting, simple joins, and predictable filtering, think star schema.
If it mentions big data exploration or flexible schema evolution, star schema in a lakehouse may be part of the answer.

Practice Questions:

Here are 10 questions to test and help solidify your learning and knowledge. As you review these and other questions in your preparation, make sure to …

  • Identifying and understand why an option is correct (or incorrect) — not just which one
  • Look for and understand the usage scenario of keywords in exam questions to guide you
  • Expect scenario-based questions rather than direct definitions

1. What is the defining characteristic of a star schema?

A. Multiple fact tables connected through bridge tables
B. A central fact table connected directly to dimension tables
C. Fully normalized transactional tables
D. A schema optimized for OLTP workloads

Correct Answer: B

Explanation:
A star schema consists of a central fact table directly linked to surrounding dimension tables, forming a star-like structure optimized for analytics.

2. Which type of data is stored in a fact table?

A. Descriptive attributes such as names and categories
B. Hierarchical metadata for navigation
C. Quantitative, measurable values
D. User access permissions

Correct Answer: C

Explanation:
Fact tables store numeric measures (e.g., sales amount, quantity) that are aggregated during analytical queries.

3. Which table type is typically smaller and used for filtering and grouping?

A. Fact table
B. Dimension table
C. Bridge table
D. Staging table

Correct Answer: B

Explanation:
Dimension tables store descriptive attributes and are commonly used for filtering, grouping, and slicing fact data in reports.

4. Why are star schemas preferred for Power BI semantic models?

A. They eliminate the need for relationships
B. They align naturally with BI tools and optimize query performance
C. They reduce OneLake storage usage
D. They replace DAX calculations

Correct Answer: B

Explanation:
Power BI and other BI tools are optimized for star schemas, which simplify joins, reduce model complexity, and improve performance.

5. When implementing a star schema in a Fabric lakehouse, which storage format is typically used?

A. CSV
B. JSON
C. Parquet
D. Delta

Correct Answer: D

Explanation:
Fabric lakehouses store tables in Delta format, which supports ACID transactions and efficient analytical querying.

6. Which scenario most strongly suggests using a warehouse instead of a lakehouse for a star schema?

A. Schema evolution and exploratory data science
B. High-performance, SQL-based BI reporting
C. Streaming ingestion of real-time events
D. Semi-structured data exploration

Correct Answer: B

Explanation:
Fabric warehouses are optimized for SQL-based analytics and BI workloads, making them ideal for star schemas supporting reporting scenarios.

7. What does the “grain” of a fact table describe?

A. The number of dimensions in the table
B. The level of detail represented by each row
C. The size of the table in storage
D. The indexing strategy

Correct Answer: B

Explanation:
The grain defines the level of detail for each row in the fact table (e.g., one row per transaction or per day).

8. What is a conformed dimension?

A. A dimension used by only one fact table
B. A dimension that contains only numeric values
C. A shared dimension used consistently across multiple fact tables
D. A dimension generated dynamically at query time

Correct Answer: C

Explanation:
Conformed dimensions are shared across multiple fact tables, enabling consistent filtering and reporting across different business processes.

9. Which design choice improves performance when querying star schemas?

A. Highly normalized dimension tables
B. Complex many-to-many relationships
C. Simple joins between fact and dimension tables
D. Storing dimensions inside the fact table

Correct Answer: C

Explanation:
Star schemas minimize join complexity by using simple, direct relationships between facts and dimensions, improving query performance.

10. Which statement best describes how star schemas fit into the Fabric analytics lifecycle?

A. They replace semantic models entirely
B. They are used only for real-time analytics
C. They provide an analytics-ready structure for reporting and modeling
D. They are required only for data ingestion

Correct Answer: C

Explanation:
Star schemas organize data into an analytics-ready structure that supports semantic models, reporting, and scalable BI workloads.

Enrich data by adding new columns and tables

This post is a part of the DP-600: Implementing Analytics Solutions Using Microsoft Fabric Exam Prep Hub; and this topic falls under these sections: 
Prepare data
--> Transform data
--> Enrich data by adding new columns and tables

Data enrichment is a critical step in preparing analytics-ready datasets in Microsoft Fabric. This section of the DP-600 exam focuses on how analytics engineers enhance existing data by adding derived columns, augmenting datasets with new tables, and combining multiple data sources to provide more business context and analytical value.

What Does Data Enrichment Mean in Fabric?

Data enrichment involves extending raw or curated datasets with additional attributes, calculations, or related entities so that the data is more useful for reporting, analytics, and downstream consumption.

In Microsoft Fabric, enrichment can occur across:

  • Lakehouses
  • Data Warehouses
  • Dataflows Gen2
  • Power BI semantic models
  • SQL analytics endpoints

Adding New Columns

Common Ways to Add Columns

  • Calculated columns using SQL expressions
  • Derived columns in Dataflows Gen2
  • Computed columns in warehouses or lakehouses
  • Calculated columns in semantic models (DAX)

Typical Use Cases

  • Creating business-friendly attributes (e.g., full name, year-month)
  • Applying business rules (e.g., customer segment, status flags)
  • Performing type conversions or formatting
  • Adding derived metrics (e.g., profit, margin, age)

Where This Is Done

  • Lakehouse / Warehouse (SQL): Persistent, reusable transformations
  • Dataflows Gen2: Low-code, ETL-style transformations
  • Semantic models (DAX): Report-specific or analytical calculations

Exam Tip

Know where to add a column based on reuse, performance, and governance. Foundational logic belongs earlier in the data pipeline.

Adding New Tables

How New Tables Are Created

  • Creating tables from queries or transformations
  • Materializing enriched datasets
  • Joining multiple source tables into curated outputs
  • Creating dimension or fact tables for analytics

Common Use Cases

  • Creating lookup or reference tables
  • Building star schema components
  • Storing aggregated or summarized data
  • Supporting reuse across multiple reports and models

Fabric Components Involved

  • Lakehouse tables (Delta format)
  • Warehouse tables
  • Dataflows Gen2 outputs
  • Shared semantic models

Enrichment Through Joins and Relationships

Enrichment Patterns

  • Joining transactional data with reference data
  • Adding descriptive attributes from lookup tables
  • Combining data from multiple domains (e.g., sales + geography)

Best Practices

  • Use appropriate join types (inner, left, etc.)
  • Ensure consistent data types and keys
  • Validate row counts and data integrity
  • Avoid unnecessary denormalization when not required

Exam Tip

Understand the impact of joins on data volume, performance, and data correctness.

Enrichment Using Dataflows Gen2

Dataflows Gen2 are a key enrichment tool in Fabric:

  • Low-code Power Query transformations
  • Combine, append, and merge datasets
  • Add derived and conditional columns
  • Output enriched tables to OneLake

Ideal for:

  • Source-level enrichment
  • Repeatable, governed transformations
  • Non-SQL-based data preparation

Enrichment in Semantic Models

Some enrichment happens at the modeling layer:

  • Calculated columns (DAX)
  • Calculated tables
  • Role-playing dimensions

However:

  • Semantic-layer enrichment is best for analysis, not heavy transformation
  • Overuse can impact model performance and complexity

Governance and Performance Considerations

  • Prefer enriching data upstream when logic is reusable
  • Document derived columns and tables
  • Apply consistent naming conventions
  • Avoid duplicating enrichment logic across layers
  • Balance flexibility with maintainability

What to Know for the DP-600 Exam

You should be comfortable with:

  • When to add columns vs. when to add tables
  • Choosing the right Fabric component for enrichment
  • SQL vs. Power Query vs. DAX enrichment
  • Performance and governance trade-offs
  • Supporting analytics-ready and reusable datasets

Practice Questions:

Here are 10 questions to test and help solidify your learning and knowledge. As you review these and other questions in your preparation, make sure to …

  • Identifying and understand why an option is correct (or incorrect) — not just which one
  • Look for and understand the usage scenario of keywords in exam questions to guide you
  • Expect scenario-based questions rather than direct definitions

1. What is the primary goal of data enrichment in Microsoft Fabric?

A. Reduce data storage costs
B. Improve infrastructure security
C. Increase analytical value by adding context
D. Replace raw data sources

Correct Answer: C

Explanation:
Data enrichment enhances datasets by adding derived attributes or related data so that the data becomes more meaningful and useful for analytics and reporting.

2. Where should reusable business logic for derived columns ideally be implemented?

A. Power BI report visuals
B. Semantic model calculated columns
C. Lakehouse or warehouse SQL transformations
D. Ad-hoc DAX measures

Correct Answer: C

Explanation:
Reusable business logic should be implemented upstream (lakehouse or warehouse) to promote consistency, reuse, and better governance across multiple reports and models.

3. Which Fabric feature is best suited for low-code enrichment such as merging datasets and adding conditional columns?

A. SQL analytics endpoint
B. Dataflows Gen2
C. Eventhouse
D. Real-Time hub

Correct Answer: B

Explanation:
Dataflows Gen2 use Power Query to perform low-code transformations, including merges, derived columns, and conditional logic, making them ideal for enrichment scenarios.

4. When enriching data by joining tables, which join type preserves all rows from the primary dataset?

A. Inner join
B. Right join
C. Left join
D. Cross join

Correct Answer: C

Explanation:
A left join preserves all rows from the left (primary) table while adding matching data from the right table where available.

5. Which scenario best justifies creating a new enriched table instead of adding columns to an existing one?

A. Adding a formatting column for display
B. Creating a reusable dimension table
C. Renaming an existing column
D. Filtering rows for a specific report

Correct Answer: B

Explanation:
Creating a new table is appropriate when building reusable dimension or reference tables that support multiple fact tables or analytics use cases.

6. Why should heavy transformation logic generally be avoided in Power BI semantic models?

A. Semantic models cannot handle transformations
B. It increases OneLake storage usage
C. It can negatively affect performance and maintainability
D. Semantic models do not support calculated columns

Correct Answer: C

Explanation:
While semantic models support calculated columns and tables, heavy transformation logic is better handled upstream to improve performance and simplify model maintenance.

7. Which of the following is an example of enriching data by adding a new column?

A. Changing workspace permissions
B. Adding a “Customer Segment” column based on business rules
C. Publishing a semantic model
D. Creating a new workspace

Correct Answer: B

Explanation:
Derived columns such as customer segmentation add business context to data, which is a classic enrichment scenario.

8. What is a key benefit of enriching data earlier in the data pipeline?

A. Faster report publishing
B. Reduced need for Power BI licenses
C. Improved consistency across analytics assets
D. Automatic index creation

Correct Answer: C

Explanation:
Enriching data upstream ensures that all downstream consumers use the same logic and definitions, improving consistency and governance.

9. Which Fabric storage format is typically used when creating enriched tables in a lakehouse?

A. CSV
B. Parquet
C. Delta
D. JSON

Correct Answer: C

Explanation:
Lakehouse tables in Microsoft Fabric are stored in Delta format, which supports ACID transactions and efficient analytics.

10. Which factor should most influence where enrichment logic is implemented?

A. User interface preferences
B. Reusability and performance considerations
C. The number of Power BI visuals
D. Workspace naming conventions

Correct Answer: B

Explanation:
Choosing where to enrich data depends on how reusable the logic is and how it affects performance, scalability, and governance.

Create Views, Functions, and Stored Procedures

This post is a part of the DP-600: Implementing Analytics Solutions Using Microsoft Fabric Exam Prep Hub; and this topic falls under these sections: 
Prepare data
--> Transform data
--> Create views, functions, and stored procedures

Creating views, functions, and stored procedures is a core data transformation and modeling skill for analytics engineers working in Microsoft Fabric. These objects help abstract complexity, improve reusability, enforce business logic, and optimize downstream analytics and reporting.

This section of the DP-600 exam focuses on when, where, and how to use these objects effectively across Fabric components such as Lakehouses, Warehouses, and SQL analytics endpoints.

Views

What are Views?

A view is a virtual table defined by a SQL query. It does not store data itself but presents data dynamically from underlying tables.

Where Views Are Used in Fabric

  • Fabric Data Warehouse
  • Lakehouse SQL analytics endpoint
  • Exposed to Power BI semantic models and other consumers

Common Use Cases

  • Simplify complex joins and transformations
  • Present curated, analytics-ready datasets
  • Enforce column-level or row-level filtering logic
  • Provide a stable schema over evolving raw data

Key Characteristics

  • Always reflect the latest data
  • Can be used like tables in SELECT statements
  • Improve maintainability and readability
  • Can support security patterns when combined with permissions

Exam Tip

Know that views are ideal for logical transformations, not heavy compute or data persistence.

Functions

What are Functions?

Functions encapsulate reusable logic and return a value or a table. They help standardize calculations and transformations across queries.

Types of Functions (SQL)

  • Scalar functions: Return a single value (e.g., formatted date, calculated metric)
  • Table-valued functions (TVFs): Return a result set that behaves like a table

Where Functions Are Used in Fabric

  • Fabric Warehouses
  • SQL analytics endpoints for Lakehouses

Common Use Cases

  • Standardized business calculations
  • Reusable transformation logic
  • Parameterized filtering or calculations
  • Cleaner and more modular SQL code

Key Characteristics

  • Improve consistency across queries
  • Can be referenced in views and stored procedures
  • May impact performance if overused in large queries

Exam Tip

Functions promote reuse and consistency, but should be used thoughtfully to avoid performance overhead.

Stored Procedures

What are Stored Procedures?

Stored procedures are precompiled SQL code blocks that can accept parameters and perform multiple operations.

Where Stored Procedures Are Used in Fabric

  • Fabric Data Warehouses
  • SQL endpoints that support procedural logic

Common Use Cases

  • Complex transformation workflows
  • Batch processing logic
  • Conditional logic and control-of-flow (IF/ELSE, loops)
  • Data loading, validation, and orchestration steps

Key Characteristics

  • Can perform multiple SQL statements
  • Can accept input and output parameters
  • Improve performance by reducing repeated compilation
  • Support automation and operational workflows

Exam Tip

Stored procedures are best for procedural logic and orchestration, not ad-hoc analytics queries.

Choosing Between Views, Functions, and Stored Procedures

ObjectBest Used For
ViewsSimplifying data access and shaping datasets
FunctionsReusable calculations and logic
Stored ProceduresComplex, parameter-driven workflows

Understanding why you would choose one over another is frequently tested on the DP-600 exam.

Integration with Power BI and Analytics

  • Views are commonly consumed by Power BI semantic models
  • Functions help ensure consistent calculations across reports
  • Stored procedures are typically part of data preparation or orchestration, not directly consumed by reports

Governance and Best Practices

  • Use clear naming conventions (e.g., vw_, fn_, sp_)
  • Document business logic embedded in SQL objects
  • Minimize logic duplication across objects
  • Apply permissions carefully to control access
  • Balance reusability with performance considerations

What to Know for the DP-600 Exam

You should be comfortable with:

  • When to use views vs. functions vs. stored procedures
  • How these objects support data transformation
  • Their role in analytics-ready data preparation
  • How they integrate with Lakehouses, Warehouses, and Power BI
  • Performance and governance implications

Practice Questions:

Here are 10 questions to test and help solidify your learning and knowledge. As you review these and other questions in your preparation, make sure to …

  • Identifying and understand why an option is correct (or incorrect) — not just which one
  • Look for and understand the usage scenario of keywords in exam questions to guide you
  • Expect scenario-based questions rather than direct definitions

1. What is the primary purpose of creating a view in a Fabric lakehouse or warehouse?

A. To permanently store transformed data
B. To execute procedural logic with parameters
C. To provide a virtual, query-based representation of data
D. To orchestrate batch data loads

Correct Answer: C

Explanation:
A view is a virtual table defined by a SQL query. It does not store data but dynamically presents data from underlying tables, making it ideal for simplifying access and shaping analytics-ready datasets.

2. Which Fabric component commonly exposes views directly to Power BI semantic models?

A. Eventhouse
B. SQL analytics endpoint
C. Dataflow Gen2
D. Real-Time hub

Correct Answer: B

Explanation:
The SQL analytics endpoint (for lakehouses and warehouses) exposes tables and views that Power BI semantic models can consume using SQL-based connectivity.

3. When should you use a scalar function instead of a view?

A. When you need to return a dataset with multiple rows
B. When you need to encapsulate reusable calculation logic
C. When you need to perform batch updates
D. When you want to persist transformed data

Correct Answer: B

Explanation:
Scalar functions are designed to return a single value and are ideal for reusable calculations such as formatting, conditional logic, or standardized metrics.

4. Which object type can return a result set that behaves like a table?

A. Scalar function
B. Stored procedure
C. Table-valued function
D. View index

Correct Answer: C

Explanation:
A table-valued function (TVF) returns a table and can be used in FROM clauses, similar to a view but with parameterization support.

5. Which scenario is the best use case for a stored procedure?

A. Creating a simplified reporting dataset
B. Applying row-level filters for security
C. Running conditional logic with multiple SQL steps
D. Exposing data to Power BI reports

Correct Answer: C

Explanation:
Stored procedures are best suited for procedural logic, including conditional branching, looping, and executing multiple SQL statements as part of a workflow.

6. Why are views commonly preferred over duplicating transformation logic in reports?

A. Views improve report rendering speed automatically
B. Views centralize and standardize transformation logic
C. Views permanently store transformed data
D. Views replace semantic models

Correct Answer: B

Explanation:
Views allow transformation logic to be defined once and reused consistently across multiple reports and consumers, improving maintainability and governance.

7. What is a potential downside of overusing functions in large SQL queries?

A. Increased storage costs
B. Reduced data freshness
C. Potential performance degradation
D. Loss of security enforcement

Correct Answer: C

Explanation:
Functions, especially scalar functions, can negatively impact query performance when used extensively on large datasets due to repeated execution per row.

8. Which object is most appropriate for parameter-driven data preparation steps in a warehouse?

A. View
B. Scalar function
C. Table
D. Stored procedure

Correct Answer: D

Explanation:
Stored procedures support parameters, control-of-flow logic, and multiple statements, making them ideal for complex, repeatable data preparation tasks.

9. How do views support governance and security in Microsoft Fabric?

A. By encrypting data at rest
B. By defining workspace-level permissions
C. By exposing only selected columns or filtered rows
D. By controlling OneLake storage access

Correct Answer: C

Explanation:
Views can limit the columns and rows exposed to users, helping implement logical data access patterns when combined with permissions and security models.

10. Which statement best describes how these objects fit into Fabric’s analytics lifecycle?

A. They replace Power BI semantic models
B. They are primarily used for real-time streaming
C. They prepare and standardize data for downstream analytics
D. They manage infrastructure-level security

Correct Answer: C

Explanation:
Views, functions, and stored procedures play a key role in transforming, standardizing, and preparing data for consumption by semantic models, reports, and analytics tools.

Merging Two Excel Files or Sheets Using Power Query (with the merge based on Multiple Columns)

Excel Power Query is a powerful, no-code/low-code tool that allows you to combine and transform data from multiple sources in a repeatable and refreshable way. One common use case is merging two Excel files or worksheets based on multiple matching columns, similar to a SQL join. Power Query is a major part of Power BI, but it can be used in Excel.

When to Use Power Query for Merging

Power Query is ideal when:

  • You receive recurring Excel files with the same structure
  • You need a reliable, refreshable merge process
  • You want to avoid complex formulas like VLOOKUP or XLOOKUP across many columns

Step-by-Step Overview

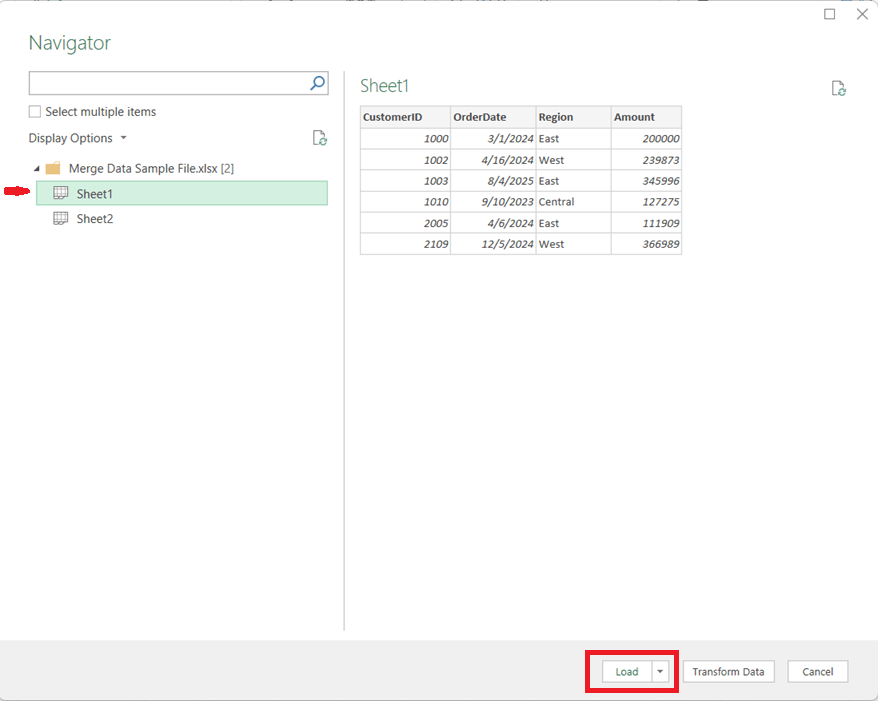
1. Load Both Data Sources into Power Query

  • Open Excel and go to Data → Get Data
  • Choose From Workbook (for separate files) or From Table/Range (for sheets in the same file)

Tip: Ensure the columns you plan to merge on have the same data types (e.g., text vs. number).


  • Load each dataset into Power Query as a separate query

2. Start the Merge Operation

  • In Power Query, select the primary table
  • Go to Query → Merge Queries
  • Choose the secondary table from the dropdown

3. Select Multiple Matching Columns

  • Click the first matching column in the primary table
  • Hold Ctrl (or Cmd on Mac) and select additional matching columns
  • Repeat the same column selections in the secondary table, in the same order

For example, if you needed to perform the merge on CustomerID, OrderDate, and Region, you would click Customer ID, then hold the Ctrl key and click OrderDate, then (while still holding down the Ctrl key) click Region.

Power Query treats this as a composite key, and all selected columns must match for rows from both tables to merge.


4. Choose the Join Type

Select the appropriate join kind:

  • Left Outer – Keep all rows from the first table (most common) and brings in the values for the matching rows from the second table
  • Inner – Keep only matching rows from both tables
  • Full Outer – Keep all rows from both tables, merging the table where there is a match and having just the values from the respective tables when there is no match

Click OK to complete the merge.


5. Expand the Merged Data

  • A new column appears containing nested tables
  • Click the expand icon to select which columns to bring in
  • Remove unnecessary columns to keep the dataset clean

6. Load and Refresh

  • Click Close & Load
  • The merged dataset is now available in Excel
  • When source files change, simply click Refresh to update everything automatically

Key Benefits

  • Handles multi-column joins cleanly and reliably
  • Eliminates fragile lookup formulas
  • Fully refreshable and auditable
  • Scales well as data volume grows

In Summary

Using Power Query to merge Excel data on multiple columns brings database-style joins into Excel, making your workflows more robust, maintainable, and professional. Once set up, it saves time and reduces errors—especially for recurring reporting and analytics tasks.

Thanks for reading!

Understanding UNION, INTERSECT, and EXCEPT in Power BI DAX

When working with data in Power BI, it’s common to need to combine, compare, or filter tables based on their rows. DAX provides three powerful table / set functions for this: UNION, INTERSECT, and EXCEPT.

These functions are especially useful in advanced calculations, comparative analysis, and custom table creation in reports. If you have used these functions in SQL, the concepts here will be familiar.

Sample Dataset

We’ll use the following two tables throughout our examples:

Table: Sales_2024

The above table (Sales_2024) was created using the following DAX code utilizing the DATATABLE function (or you could enter the data directly using the Enter Data feature in Power BI):

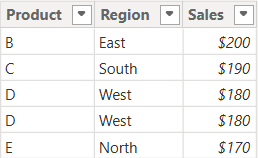
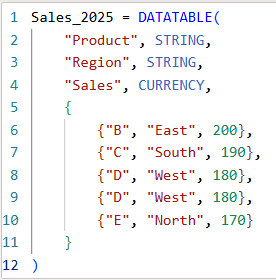
Table: Sales_2025

The above table (Sales_2025) was created using the following DAX code utilizing the DATATABLE function (or you could enter the data directly using the Enter Data feature in Power BI):

Now that we have our two test tables, we can now use them to explore the 3 table / set functions – Union, Intersect, and Except.

1. UNION – Combine Rows from Multiple Tables

The UNION function returns all rows from both tables, including duplicates. It requires the same number of columns and compatible data types in corresponding columns in the the tables being UNION’ed. The column names do not have to match, but the number of columns and datatypes need to match.

DAX Syntax:

UNION(<Table1>, <Table2>)

For our example, here is the syntax and resulting dataset:

UnionTable = UNION(Sales_2024, Sales_2025)

As you can see, the UNION returns all rows from both tables, including duplicates.

If you were to reverse the order of the tables (in the function call), the result remains the same (as shown below):

To remove duplicates, you can wrap the UNION inside a DISTINCT() function call, as shown below:

2. INTERSECT – Returns Rows Present in Both Tables

The INTERSECT function returns only the rows that appear in both tables (based on exact matches across all columns).

DAX Syntax:

INTERSECT(<Table1>, <Table2>)

For our example, here is the syntax and resulting dataset:

IntersectTable = INTERSECT(Sales_2024, Sales_2025)

Only the rows in Sales_2024 that are also found in Sales_2025 are returned.

If you were to reverse the order of the tables, you would get the following result:

IntersectTableReverse = INTERSECT(Sales_2025, Sales_2024)

In this case, it returns only the rows in Sales_2025 that are also found in Sales_2024. Since the record with “D – West – $180” exists twice in Sales_2025, and also exists in Sales_2024, then both records are returned. So, while it might not be relevant for all datasets, order does matter when using INTERSECT.

3. EXCEPT – Returns Rows in One Table but Not the Other

The EXCEPT function returns rows from the first table that do not exist in the second.

DAX Syntax:

EXCEPT(<Table1>, <Table2>)

For our example, here is the syntax and resulting dataset:

ExceptTable = EXCEPT(Sales_2024, Sales_2025)

Only the rows in Sales_2024 that are not in Sales_2025 are returned.

If you were to reverse the order of the tables, you would get the following result:

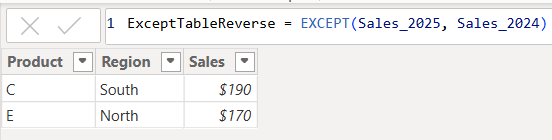
ExceptTableReverse = EXCEPT(Sales_2025, Sales_2024)

Only the rows in Sales_2025 that are not in Sales_2024 are returned. Therefore, as you have seen, since it pulls data from the first table that does not exist in the second, order does matter when using EXCEPT.

Comparison table summarizing the 3 functions:

FunctionUNIONINTERSECTEXCEPT
Purpose & OutputReturns all rows from both tablesReturns rows that appear in both tables (i.e., rows that match across all columns in both tables)Returns rows from the first table that do not exist in the second
Match CriteriaColumn position (number of columns) and datatypesColumn position (number of columns) and datatypes and valuesColumn position (number of columns) and datatypes must match and values must not match
Order Sensitivityorder does not matterorder matters if you want duplicates returned when they exist in the first tableorder matters
Duplicate HandlingKeeps duplicates. They can be removed by using DISTINCT()Returns duplicates only if they exist in the first tableReturns duplicates only if they exist in the first table

Additional Notes for your consideration:

  • Column Names: Only the column names from the first table are kept; the second table’s columns must match in count and data type.
  • Performance: On large datasets, these functions can be expensive, so you should consider filtering the data before using them.
  • Case Sensitivity: String comparisons are generally case-insensitive in DAX.
  • Real-World Use Cases:
    • UNION – Combining a historical dataset and a current dataset for analysis.
    • INTERSECT – Finding products sold in both years.
    • EXCEPT – Identifying products discontinued or newly introduced.

Thanks for reading!

SQL Tips: How to generate insert statements using the data from the output of a select statement using Toad

If you need to build insert statements for many rows of data for inserting that data into another table or into the same table in a different environment, there is a convenient way to do this in Toad. This is often needed to move data around.

In Toad, execute the appropriate select statement on the source table …

Select * from [my_schema].[my_simple_table];

I used a simple “select *” above, but your SQL statement can be any valid SQL statement that returns the data you want to insert into the other table. You may add specific columns, add filters, joins, and any other valid SQL operation.

Let’s say you want to insert the output into another table in a different schema.

Right-click on the output result data, and click “Export Dataset…”

From the “Export format” drop down menu, choose “Insert Statements”

In the Output section of the Export Dataset dialog box, enter the location and name of the Insert Script file that will be generated.

There are several other parameters that you could choose but we won’t cover them all here.

If you only wanted to generate inserts for some selected rows, select “Export only selected rows”.

If you need to specify the schema of the target table, select “Include schema name”

In the Table section, enter the name of the target schema and table

Note, there are data masking options available that can be very useful if, for example, you are moving some data from a Production environment to a Non-Production environment, and you do not want to expose the data there.

After you have set the parameters relevant to your scenario, Click “OK”.

The Insert Script file of all the data will be generated with the filename and at the location you specified. And the insert statements will include the name of the schema and table you specified.

Thanks for reading!

SQL Tips: How to rename a column in a table – Oracle database – Oracle SQL

At times you will need to change the name of a column in an existing table. If you are not changing the data type, it is just one statement / step that needs to be executed. However, I strongly recommend that you also do a backup step, especially if you’re making the change in a production environment, just in case of an unexpected issue.

If you choose to do the backup, you may perform this with a “create-table-as-select” statement in this form:

create table [table_name_backup] as select * from [table_name];

Here is an example of the above statement:

create table EMPLOYEES_BKUP as select * from EMPLOYEES;

Now that the table you are modifying is all backed up, you can proceed to rename the column.

The rename SQL statement would take this form:

alter table [table_name] rename column [existing_column_name] to [new_column_name];

An example of the statement:

alter table EMPLOYEES rename column SEX to GENDER;

Thanks for reading! I hope you found this information useful.

SQL tips: Get last day and first day of month – Oracle SQL

At times you may need to dynamically determine the first or last day of a month based on the current date or some date in your data. This post provides a few options for deriving the First day of month, and Last day of month. And also, it provides a couple tweaks to get Last day of the next or previous month.

Get the current date (today’s date):
select sysdate from dual;

SYSDATE

16-MAY-22

Get the last day of the current month:
select trunc(last_day(sysdate)) as LastDayOfMonth from dual;

LASTDAYOFMONTH

31-MAY-22

Side note: The last_day() function can also be useful for dynamically determining leap years (that is, whether February has 28 or 29 days)
select
last_day(date ‘2020-02-01’) LastDayOfFeb2020, — leap year
last_day(date ‘2021-02-01’) LastDayOfFeb2021 — not a leap year
from dual;

LASTDAYOFFEB2020 LASTDAYOFFEB2021

29-FEB-20 28-FEB-21

Get the last day of the next month:
select add_months(trunc(last_day(sysdate)), 1) as LastDayOfNextMonth from dual;

LASTDAYOFNEXTMONTH

30-JUN-22

Get the last day of the previous month:
select add_months(trunc(last_day(sysdate)), -1) as LastDayOfPreviousMonth from dual;

LASTDAYOFPREVIOUSMONTH

30-APR-22

Get the first day of the current month:

select trunc(sysdate,’month’) as FirstDayOfMonth from dual;
select trunc(sysdate,’MM’) as FirstDayOfMonth from dual;

FIRSTDAYOFMONTH

01-MAY-22

Get the first day of the next month:

select add_months(trunc(sysdate,’MM’), 1) as FirstDayOfNextMonth from dual;

FIRSTDAYOFNEXTMONTH

01-JUN-22

You can also get the first day of the next month using this:
select trunc(last_day(sysdate)+1) as FirstDayOfNextMonth from dual;

FIRSTDAYOFNEXTMONTH

01-JUN-22

Get the first day of the previous month:

select add_months(trunc(sysdate,’MM’), -1) as FirstDayOfPreviousMonth from dual;

FIRSTDAYOFPREVIOUSMONTH

01-APR-22

Here are 3 resources for getting the first and last day of the month values on a SQL Server database:

https://zarez.net/?p=2462

Thanks for reading! I hope you found this information useful!

Good luck on your data journey.