Category: Reporting

OBIEE Agent sending emails to the wrong recipients

We recently ran into an issue where we had an OBI Agent setup to send personalized reports via email to each recipient but some recipients (about 2%) were receiving the wrong email.

A search of Oracle Support produced Document ID # 2119485.1 as a possible solution.

“OBIEE 11g|12c: Agents Send Emails To Incorrect Recipients When Master Trigger Agent Is Present (Doc ID 2119485.1)”

This document recommended applying patch #s 22821787 and 25545058.

However, we are on OBIEE 12c (12.2.1.2.0) and one of the patches seemed to be for 11g only.

  • Patch # 25545058 seemed to be for 11g only.
  • Patch # 22821787 was for both 11g and 12c versions.

We applied patch # 22821787, but unfortunately, the issue persisted.

After looking around some more, we realized there was another patch but for the 12.2.1.2.180116 release (found in Document ID # 2395331.1). It didn’t match our version, but we decided to explore it anyway.

“OBIEE 12c : Agent Sending The Incorrect Result (Doc ID 2395331.1)”

That was patch # 27072632 but it turns out that patch was superseded by patch # 27916905.

Our admin team tried to apply patch # 27916905, but it had a conflict with the initial patch # 22821787.

We then backed out patch # 22821787 and applied the bundle patch 27916905.

The patch # 27916905 seems to have resolved the “email going to wrong recipients” issue.  Since we applied it, no user has reported they received the wrong email. However, we are not yet 100% sure.

However, we are noticing that some images are not displaying properly which may have been caused by the patch. We are looking into that issue now.

I went through the detailed description of how the patches were found to let you realize that on the Oracle Support site, you may need to do a very thorough search to find any and all patches related to an issue before applying any. The documentation does not necessarily tie them together or they won’t necessarily come up in when you search on the keywords. Note: Before any of the above changes were made, backups were taken so that we could revert to any stage that we wanted to.

Creating a Business Intelligence (BI) & Analytics Strategy and Roadmap

This post provides some of my thoughts on how to go about creating a Business Intelligence (BI) & Analytics Strategy and Roadmap for your client or company.  Please comment with your suggestions from your experience for improving this information.


When creating or updating the BI & Analytics Strategy and Roadmap for a company, one of the first things to understand is:

Who are all the critical stakeholders that need to be involved?

Understanding who needs and uses the BI & Analytics systems is critical for starting the process of understanding and documenting the “who needs what, why, and when”.

These are some of the roles that are typically important stakeholders:

  • High-level business executives that are paying for the projects
  • Business directors involved in the usage of the systems
  • IT directors involved in the developing and support of the systems
  • Business Subject Matter Experts (SME’s) & Business Analysts
  • BI/Analytics/Data/System Architects
  • BI/Analytics/Data/System Developers and Administrators


Then, you need to ask all these stakeholders, especially those from the business:

What are the drivers for BI & Analytics? And what is the level of importance for each of these drivers?

This will help you to understand and document what business needs are creating the need for new or modified BI & Analytics solutions. You should then go deeper to understand … what are the business objectives and goals that are driving these business needs.  This will help you to understand and document the bigger picture so that a more comprehensive strategy and roadmap can be created.

The questions and discussions surrounding the above will require deep and broad business involvement. Getting the perspective of a wide range of users from all business areas that are using the BI & Analytics Systems is critical.  The business should be involved throughout the process of creating the strategy and roadmap, and all decisions should tie back to support for business objectives and goals. And the trail leading to all these decisions must be documented.

Some examples of business drivers include:

  • Gain more insight into who our best customers are and how best to acquire them.
  • Understand how weather affects our sales/revenue.
  • Determine how we can sell more to our existing customers.
  • Understand what causes employee turnover.
  • Gain insight into how we can improve staffing schedules.


And examples of business objectives and goals may include things like:

  • Increase corporate revenues by 10%
  • Grow our base of recurring customers
  • Stabilize corporate revenues over all seasons
  • Create an environment where employees love to work
  • Reduce payroll costs without a reduction in staff, for example, reduce turnover.


Then, turn to understanding and documenting the current scenario (if not already known). Identify what systems (including data sources) are in place, who are using them (and why and how), what capabilities do they offer, what are the must-haves, and what are the pain points and positive highlights.

Also, you will need to determine the current workload (and future workload if it can be determined) of the primary team members involved in developing, testing, and implementing BI & Analytics solutions.

This will help you understand a few things:

  • Some of the highest priority needs of the users
  • Gaps in capabilities and data between what is needed and what is currently in place (including an understanding of what is liked and disliked about the current systems)
  • Current user base knowledge and engagement
  • IT knowledge and skills
  • Resource availability – when are people available to work on new initiatives


What are the options and limitations?

  • Can existing systems be customized to meet the requirements?
  • Can they be upgraded to a new version that has the needed functionality?
  • Do we need to consider adding a new platform or replacing one or more of the existing systems with a new platform?
  • Can we migrate from/integrate one system to/with another system that we already have up and running?
  • Are any of our current systems losing vendor support or require an upgrade for other reasons? Has the pricing changed for any of our software applications?
  • What options does our budget permit us to explore?
  • What options do our knowledge and skills permit us to explore?


Once you have identified these items …

  • Identify and engage stakeholders, and document these roles and the people
  • Identify and document business drivers, objectives and goals
  • Understand and document the current landscape – needs (including must-haves), technology, gaps, users, IT staff, resource availability, and more
  • Identify and document options – based on current landscape, technology, budget, staff resources, etc.

… you can develop a “living” Strategy and Roadmap for BI & Analytics. And when I say “living”, I mean it will not be a static document, but will be fine-tuned over time as new information emerge and as changes arise in business needs, technology, and staff resources.


Your Strategy and Roadmap for BI & Analytics should include, but is not limited to:

  • BI & Analytics that will be used to satisfy business drivers, objectives and goals
  • Data acquisition and storage plan for meeting the analytics needs
  • Technology platforms that will be used to process and store data, and deliver the analytics
  • Information about any new technologies that needs to be acquired or implemented, and schedules
  • Roles and Responsibilities for all stakeholders involved in BI & Analytics projects
  • Planned staffing allocations and schedules
  • Planned staffing changes and schedules
  • User training (business users) and Delivery team training (technical implementers & developers for example)
  • List dependencies for each item or set of items

QlikView Sheet Objects Quick Overview

This post provides a quick overview for each of the QlikView Sheet Objects.
Sheet Objects are the various objects that a developer or analyst places on a QlikView document’s sheet to provide the rich functionality of dashboards.

By right-clicking on an open area in a sheet, the below menu will appear.  Select “New Sheet Object” to see the available Sheet Object options – which are – List Box, Statistics Box, Multi Box, Table Box, Chart, Input Box, Current Selections Box, Button, Text Object, Line/Arrow Object, Slider/Calendar Object, Bookmark Object, Search Object, Container, Custom Object, and System Table.
Qlik_SheetObject_ListBox

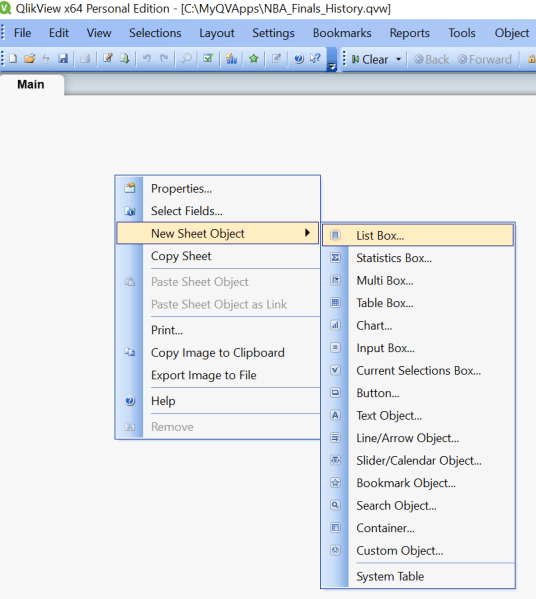
The sheet objects can also be created from the Design Toolbar selections.
Qlik_SheetObject_DesignMenu

Some of our example images are taken from the Movies Database application that comes with QlikView.

List Box
The “List Box” is one of the most heavily used QlikView sheet objects.  It lists all the distinct values of a particular field. For example, you may have a List Box that displays all the products available within your data set.  The List Box is often used as a menu, where a user selects a value to analyze the data based on that value.
Qlik_SheetObject_ListBox_example2
The above example displays 3 List Boxes – the Director list box, the Actor list box, and the Title list box. When a user selects one or more values from one or more list boxes 9or any other object), the data in all other objects cascade to show only records relevant to that combination of selections.
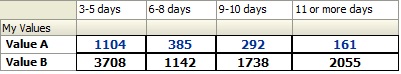
Statistics Box
The “Statistics Box” is used to show aggregated representations of the data.  There are several statistical aggregation functions that are available, such as Sum, Average, Min, Max, Std Dev, Null Count, and several more.
Qlik_SheetObject_StatisticsBox_example
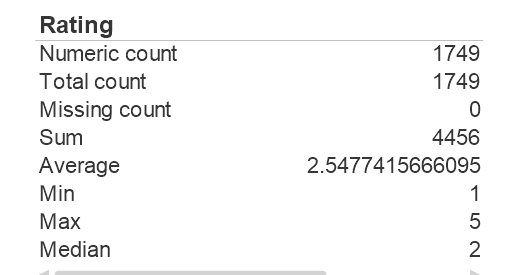
The above example shows “Statistics” for the Rating field – the number of ratings, the average rating, the min and max ratings, and the average and median ratings.

Multi Box
A Multi Box allows you to display several fields in a single object, with the values for each field available via a drop down. This object can be described as a set of List Boxes compacted together. The example screenshot below shows a Multi Box with the 3 fields, Director/Actor/Title, and by clicking any of the fields, you will get a drop down of all the values for that field – similar to a List Box for that field.
Qlik_SheetObject_MultiBox_example

Clicking on Director will display the list of all Directors, as shown below. Similarly, you can Actor or Title to get those respective drop down lists.
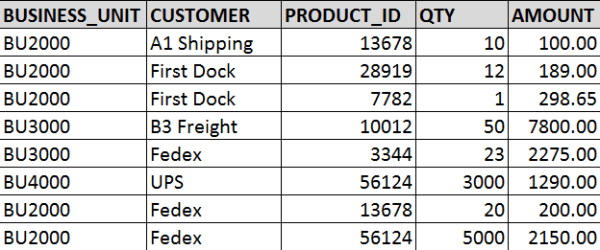
Qlik_SheetObject_MultiBox_dropdown_example

Table Box
The Table Box, as the name implies, displays a table of records for the selected data fields.
Qlik_SheetObject_TableBox_example

Chart
The Chart object is used for creating charts of various types. Some of the chart types available include bar, line, combo, radar, scatter, grid, pie, block, funnel, gauge, and mekko charts, and pivot and straight tables.
Qlik_SheetObject_Chart
The above shows one of the properties dialog tabs for the chart object – which shows some of the various chart types you can create.

Input Box
The Input Box object allows for users to enter a value. (which sets a variable that can be used for further processing)
Qlik_SheetObject_InputBox

Current Selections Box
The Current Selections Box displays all the selections that the user has selected. The Current Selections box is usually placed at the top of a sheet (dashboard page) in a position that allows users to easily see the selections that have been made.
Users are able to clear selections by clicking on the eraser beside the selection in the Current Selections Box, and the data on the sheet will change accordingly.
Qlik_SheetObject_CurrentSelectionsBox
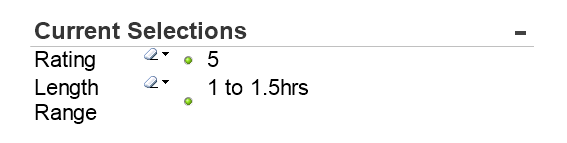
In the example above, the user has selected Rating 5 and Length Range 1 to 1.5 hrs.

Button
The Button object creates a button that can be configured to execute various types of actions. When clicked the configured action will be executed.
Qlik_SheetObject_Button

Text Object
The Text Object is used for adding simple text to the document/sheet. It can be used to display informational messages, directions, descriptions or titles and labels, or any kind of information that needs to be shared with viewers/users of the document.
Qlik_SheetObject_TextObject

Line/Arrow Object
This object is used to create a line with or without arrows, and vertical or horizontal or diagonal. This object can be used for many purposes such showing relationships and flows.
Qlik_SheetObject_LineArrow

Slider/Calendar Object
The Slider/Calendar object is used to create either a slider with multiple values that the user can slide across to select, or a calendar that the user can use to find and select a date.
Qlik_SheetObject_Slider                 Qlik_SheetObject_Calendar
In the above slider, the user has selected Rating 4.  In the calendar object, clicking the grid icon opens a calendar that allows selection.

Bookmark Object
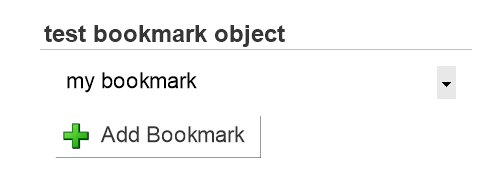
The Bookmark object is used to save the selection state of the current sheet. If a bookmark is created after a specific Actor has been selected, when you select that bookmark, the selection and corresponding data in the sheet will be displayed based on that saved selection state of the bookmark.
Multiple bookmarks can be saved for each sheet. Each having a different set of saved selections.
Qlik_SheetObject_Bookmark

Search Object
The Search Object allows users to search for values in entire data set or within a specific set of fields.
Qlik_SheetObject_Search

Container
The Container is a sheet space saving object that can contain multiple other objects, such as multiple chart objects. This allows you to display multiple views of the data within the same sheet “real estate” and change the view by clicking on the appropriate tab to get to each chart.
Qlik_SheetObject_Container
In the above example, the container contains 3 objects (3 charts), and therefore displays 3 tabs across the top, one for each chart. There are different possible orientations for the tabs – they can be to the left, right, top (as in this example), or bottom.

Custom Object
The custom object is a sheet object specifically intended to carry custom defined OCX replacement controls.
The Custom Object: Object Menu can be accessed from the Object menu, when the custom object is the active object.
Replacement controls are windowless OCX controls programmed by Qlik, yourself or third party vendors, which comply with the specifications for QlikView replacement OCX controls. The OCX control will be drawn in a rectangle on the sheet outlined by the underlying custom object. Communication between the OCX control and the QlikView document is maintained via the internal macro interpreter.
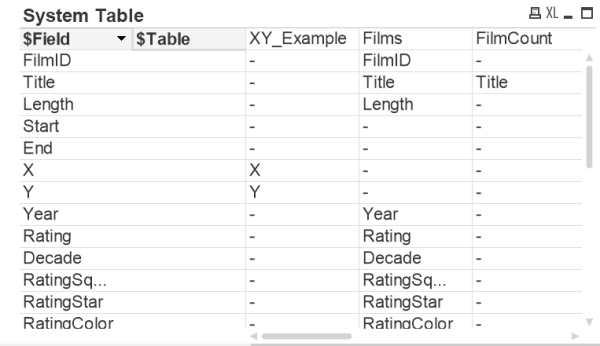
System Table
The System Table object creates a pivot table that shows the data structure of the qlikview document.
Qlik_SheetObject_SystemTable

In future posts, we will be covering each object in depth.

Implementing Reports-To data-level security in Oracle BI (OBIEE)

In a previous post, Implementing data-level security in Oracle BI (OBIEE), I described data-level security and how to implement it in Oracle Business Intelligence (OBIEE).  In this post I will describe a special type of data-level security, called Reports-To security, and how to implement it in OBI.

For Reports-To data-level security, we want to secure data in such a way that we allow a user access only to data for his/her direct and indirect reports. In other words, each user will be able to see data only for people that are below him/her in the organization hierarchical chain.

Take a look at this example diagram:

ReportsTo_Security_Org_Position_Hier

If Reports-To security is applied to this example, Position# 303 would only be able to see information for Position# 409; and Position# 305 would only be able to see information for Position#’s 410, 411, 412; and a final example, Position# 201 would be able to see the information for Position#’s 303, 304, 305, 306, and 409, 410, 411, 412.

I use “Position” as the driving entity in the hierarchy instead of “Employee” because there are times when a position is vacant (no employee) and so it’s better to use the position which will always have a value.  However, you can use Employee if that works better in your scenario or if that’s what your data supports.

Let’s move on to how to implement this type of security.  The steps are similar to the steps in a previous post, Implementing data-level security in Oracle BI (OBIEE), but with some key differences. (Refer to that post for some of the more detailed steps not reiterated in this post.)

First, build a Reports-To data table and create the necessary ETL to ensure that it remains correct and up-to-date.  This table will contain each position (employee/user) and what position (employee) they report to. The data for this table will likely come from your HR system (such as PeopleSoft, Oracle EBS, SAP, Workday, home-grown system, etc.) that contains all the position and employee data.  Using the Organization Position Hierarchy diagram example, the table (REPORTS_TO_DATA) may look something like this:

REPORTS_TO_DATA

Next, create a Session Initialization Block (Init Block) with row-wise Initialization that will be used to get the list of all positions that report to the position of the current user and store them in a defined Target Variable.  If you log in, the Init Block will generate the list with all the positions (or employees) that report to you; and when Jane logs in, the Init Block will generate the list of all the positions (or employees) that report to her.

An important component of the SQL in the Init Block is that it needs to be recursive, because for each person, it needs to retrieve their direct reports, and then retrieve the people reporting to their direct reports, and so on down the line.  Using the above Organization Position Hierarchy diagram example, when the user in Position 202 logs in, the SQL needs to retrieve the positions reporting to 202 (which are 307 & 308), and then recursively retrieve the positions reporting to 307 and 308, and so on. The Target Variable used for storing the values in this example is: REPORTS_TO_POSITIONS

The Init Block, its SQL, and variable definition may look something like this:

Reports_To_Position_InitBlock2


Then finally, we need to create the data filters on the appropriate data sets (that need to be secured) using the variable containing the “list of positions” reporting to the current user (REPORT_TO_POSITIONS variable).  The needs to be done for each role that will access the reports that need to be secured by Reports-To security.

REPORTS_TO_Data_Filter

After this is all set, then Reports-To Security will be in effect for the filtered data sets and the reports that use them.

If you need to make it such that each user can only see data for his or her direct reports, the SQL can be modified to remove the recursion, and just return the direct report positions.

One final point … as you would with all changes, but particularly with solutions involving sensitive data, test your solution thoroughly – including making sure to perform both positive and negative testing.

Thanks for reading!


Implementing data-level security in Oracle BI (OBIEE)

Data Level Security involves securing the data available in an application in such a way that each user will see only the data that he/she is authorized to see, resulting in each user possibly seeing different results on the same report.   In this post I will describe how to implement data-level security in Oracle Business Intelligence (OBIEE).

Let’s use an example to describe data-level security.  Each user of the BI system works in or is assigned to a particular Business Unit.  Each user is allowed to see only the data for his or her assigned Business Unit.

In our example, the below table lists the 4 users and the Business Unit that each of them works in or is assigned to, and therefore, should have access to.  We will call this the USER_TO_BUSINESSUNIT table.
DataLevelSecurity_UsersBUs

Jane and Xing should only be able to see data for Business Unit BU2000, Bill should be able to access data for both BU3000 and BU4000, and Venkat should be able to access data for BU4000.

Now, we will use the below table as the example data set that we need to secure with the Business Unit data-level security.  We will call this table TRANSACTION_DATA.
DataLevelSecurity_AllData

When data-level security is applied …

Jane and Xing will be able to access/see the following data:
DataLevelSecurity_BU2000

Bill will able to access/see the following data:
DataLevelSecurity_BU3000_and_BU4000

And Venkat will be able to access/see the following data:
DataLevelSecurity_BU4000

So, now let’s move on to how to implement data-level security in OBI to achieve what was described above.

First, ensure that the USER_TO_BUSINESSUNIT table data is correct and up-to-date, and that there is an ETL in place or some other method of keeping that data updated. You want to ensure that if and when a user’s Business Unit changes, it is reflected in this table so that the user will have access to the appropriate data.

Next, create a Session Initialization Block with row-wise Initialization that will be used to get the list of Business Units that a user has access to.

Open the RPD -> Manage -> Variables
ManageVariables

In the Variable Manager -> Action -> New -> Session -> Initialization Block

This needs to be a “Session” Init block so that it will run each time a user logs in, and gets that user’s list of Business Units; and it needs to be row-wise because some users will have more than 1 value returned.

New_Session_InitBlock

In the Session Variable Initialization Block Dialog, enter a Name for the Init Block.

Then click Edit Data Source
InitBlockDialog

In the Data Source dialog, enter the SQL to get the Business Units for the current logged in user.  Click OK when done which closes this window and brings you back to the Session Variable Initialization Block Dialog.

InitBlockSQL

Click Edit Data Target in the Session Variable Initialization Block Dialog.

Enter your Variable name and check “Row-wise initialization”. As mentioned above, we need to select row-wise because our Init Block SQL may return more than 1 value for some users.   For example, when Bill in our example above data logs in, the Initialization Block will return values BU3000 and BU4000, and store them in the Target Variable, “BUSINESS_UNIT”.

You may also check “Use caching” to store the values in cache. Click OK when done.

SessionInitBlock_RowWiseTargetVariable
Then click OK to save the Init Block.

InitBlock_SetupComplete

Next, apply data filter(s) to the appropriate data set(s) for the appropriate role(s) using the Target Variable above.  You may have role(s) specifically used for data-level security and will need to apply it there, but if not, you will need to apply the filters in each role that has access to the datasets/dashboards/reports that you want to apply data-level security to.

Manage -> Identity
ManageIdentity

Go to the Application Roles tab, and select the Application Role to which you would like to apply the data-level security.  In the APplication Role dialog, click Permissions.
IdentityManager_ApplicationRole

In the Permissions dialog, select the layer and data table that you want to apply the data security to, and then enter the appropriate filter.  In this example, you are filtering by BUSINESS_UNIT.  This will cause the data to be filtered to only include each users’ Business Units.
DataFilter

Save your changes.  You have now applied data-level security.  This is what will happen now:

User logs in -> Init Block runs and selects the Business Units associated with the user’s User ID -> Init Block assigns value(s) to the variable BUSINESS_UNIT -> if the user is a member of a role that has data security applied to -and- the user visits the report -> the data filter will be triggered/run -> User only sees data for the Business Units the user is allowed to see.

Look out for my upcoming post on implementing a special type of data-level security: Reports-To Data Level Security.

Thanks for reading!

Terminology Primer – Goals, Objectives, Measures, Metrics, Key Performance Indicators (KPIs), Meters

The essential purpose of business intelligence is to provide information that will allow people throughout an organization to make informed decisions relevant to their business processes and responsibilities.  This post is a simple terminology primer that describes the meaning of a few terms commonly used in business intelligence, and explain how they relate to each other, and their relevance to supporting the overall goals of an organization.

Goals are a business’ desired outcomes. They are typically around growth, cost savings, innovation, improvement in efficiency, the company’s workforce, and the competition, but may include a lot of other things.
Goals help a company to stay focused by providing team members within a company with an aim to work towards.

Objectives are specific strategies and steps that a business needs to take to achieve the goals that have set. These objectives are usually specific and measurable.  Success toward achieving objectives usually indicates progress toward achieving goals.
Objectives are sometimes referred to as Critical Success Factors because they are critical to the success of achieving the goals.

Measures are numeric representations of various transactions that occur through various business processes. For example, when the company makes a sale (during the sales process), some measures that are generated in that transaction are:  sales amount, discount amount, number of items sold, and number of items discounted.  Then from this, other measures can be determined, such as total sales for all customers, total number of items sold, total number of sales for each customer, and so on.  Measures are numeric and therefore can have mathematical calculations performed on them – such as sum, avg., min, max, etc. – to generate metrics.

Metrics are calculations derived from one or more measures. For example, as mentioned in an example above, you may have the measures “Discount Amount” and “Number of Items Discounted”, and you may use these measures to calculate a metric of “Average Discount Amount per Discounted Item” or “Average Discount Amount per Sale”.  As another example, you may simply add up all the Discount Amounts over a specific time period, such as month, to get a “Total Discount Amount by Month” metric.

Key Performance Indicators (KPIs) are metrics that measure how well a company is doing toward their objectives. Companies will have hundreds or thousands of metrics, but there will be a few key ones that the executive team wants to keep a close eye on for the overall company or divisions, and other managers will want to keep an eye on KPIs relevant to their respective departments.  Those key metrics are the KPIs. All KPIs are metrics, but not all metrics are KPIs.

Meters are a group of metrics that collectively provide a broader, overall view of a subject area.
For example, you may have individual metrics for Sales to Date, Sales in Pipeline, Number/Value of Expiring Contracts, Avg. Time to Close Sales, etc. Putting these all together in a Meter presents the user with a lot of related information that provides a broad, overall picture of sales (and loss of sales) which would allow for analysis such as determining the chances of meeting sales targets. The Meter in this example could be called “Sales Forecast” for example.

Thanks for reading!

QlikView vs. Qlik Sense

What is the difference between QlikView and Qlik Sense?  QlikView and Qlik Sense are both business intelligence platforms from the same company (Qlik), but are different products. Qlik Sense is not just a new version or release of QlikView.

The below table shows the differences and similarities between the 2 products:

QlikView Qlik Sense
First version released in 1996 First version released in 2014

Data Discovery

Same analysis/calculation engine – scripts and formulas will mostly work between the 2 platforms

Same green-gray-white (included-excluded) functionality

Both products/platforms will be enhanced and supported for the foreseeable future

Guided Analytics – drill-down and drill-through

Self-service data analytics and visualization

Dashboards and analytics/reports built by developers and pre-canned and configured for flexible user interaction Metadata for reporting developed by developers, and users create analytics
Users typically do not have the ability to create new analysis, but use the various features built to slice and dice the data. Users slice and dice the data in any creative manner that they see fit.
Open APIs allow for embedding Qlik Sense into website and other applications, and also for extending the application.
Cutting edge web interface – Responsive web interface – adapt to different screen sizes – from PC to tablet to phones – on any HTML5-compatible browser
Collaboration and story telling
Extensive Pixel-perfect formatting options

Which is better?  It depends.

If you have a user base and business needs that require answers to specific questions, without the need for user self-service BI, then QlikView is a good option.  Also, for very high control over all features of the visualizations you create, QlikView is the better choice.

However, if you have a sophisticated user base that desires to create their own analyses and business needs are more toward data discovery, then Qlik Sense is a good option.  Also, if you plan to or would like to make analytics available on all kinds of devices, then Qlik Sense is the way to go due to the responsive web design interface.

Of course, there will be other factors such as cost, and available resources and skills within the BI Team and supporting teams.  As with any software choice, a full analysis of the options and how they best meet the requirements is needed.

It’s all about the users – Identifying Users for your BI applications / dashboards

One of the first things you will need to do before developing your Business Intelligence (BI) applications or dashboards is … identify who will use it.  You need to identify who will be using the application – what business areas they belong to, what groups they belong to, what are the various functions or roles within those groups, and eventually, who are the actual people.  After identifying the various roles (groups of users typically associated with a business process or function), then you can identify their needs.  Starting any development before knowing who will be using the system could result in a lot of wasted time and effort or a sub-optimal system.  The grouping of information on dashboards, the available functionality and security will be driven by these roles and their respective needs.

After identifying the various functions or roles that users posses, then it is important to understand how each role performs their job functions.  You need to understand what information they need and in what order, how it’s used, and the level of detail required at various stages. With this information, you will determine the dashboards, dashboard pages and their order, the information on each dashboard page and its precedence and level of detail, and what detailed information is needed via drill down. Basically, you will be creating the analytic workflows for the identified roles and the various processes, functions and tasks that they perform.

When performing the above exercise, please be as discrete as possible.  For example, even if someone doubles as an AP/AR Analyst, you should still analyze and plan for 2 separate roles – AP Analyst and AR Analyst – because those are 2 separate functions.  Later, the individual or group can be granted permissions to both roles.  From a security standpoint in general, you will create the necessary BI application roles to support your business roles.  And then assign security based on these roles.

In general, always keep the focus on the users, what they need to accomplish, and the most efficient ways to help them perform their jobs.  When you build the BI security and dashboards to meet those needs and usage scenarios, it will result in higher and faster user adoption.  This will take time, so do not rush the process.  Get detailed information about all the steps in their workflow upfront, document it, and then build around it.  However, on the other hand, you do not have to document to perfection upfront, you can take a more agile approach of developing based on fairly good user profiles to give users working prototypes, and then adjusting as new information and feedback is received from the users.

Good luck identifying your users and their needs as you get your BI project rolling.  And remember, it’s all about the users!

How to conditionally set Interaction (Action Links) on a column in OBIEE 11g

This post shows an example of how to conditionally set Interaction (Action Links) on a column.

Most times, when you set “Interaction” on a column, you set it for the column under all conditions – this is the default.  However, it is possible to conditionally set “Interaction” on a column – so that the Interaction link is conditionally available.

Let’s look at an example …

You have a pivot table displaying Values by day range as shown below.  Interaction is set on the measure value, and therefore, a user can click on any of the measure values (in any column and any row) to drill/navigate to a more detailed report for example. 

(Note that all the measure values are “blue” indicating that they are hyperlinks allowing navigation to some other BI content).
1-Pivot_with_Interaction_Set_On_Measure_Value

Let’s now assume that you only want to make the Interaction available for the measure values associated with “Value A”.  Therefore, the row in your pivot table associated with “Value A” will have measure values that are clickable (hyperlinks), while the “Value B” row values will not.  In other words, you only want to allow drill down/navigation on “Value A” data.

To do this, from your analysis, edit the column properties, and go to the Interaction tab, and Edit the relevant Action Link.

3-Edit_Action_Link

Change the “Show Link” property from “Always” to “Conditionally”.

4-Show_Link_Conditionally

Then enter the condition(s) in the Conditions box. Such as in our example, we want to show/activate the action link only for “Value A” values.  So, choose the column, and then select “Value A” (and of course, do not select “Value B”).

5-Select_Value_for_Action_LInk

Now when you go back to your report, action links will only be available on the measure values for “Value A” row.

(Note that only the measure values associated with “Value A” are “blue” indicating that they are hyperlinks allowing navigation to some other BI content; while “Value B” values are black indicating that they are not clickable.)
6-After_Setting_Conditionally

You can add more conditions and more complex conditions as necessary. One thought that came to mind … I could even see this being used to conditionally set Action Links based on users – allowing some users to be able to click the action links while others just see the data without being able to click and navigate to other detail.

Adobe Flash 11.8.800.168 causing graphs/charts not to show in Internet Explorer 8

There is an issue with Internet Explorer 8 and Adobe Flash browser plugin that causes graphs/charts not to show up in OBIEE 11g.  This is not the same as the issue that can be resolved by setting the thousand place separator property. 

The versions that have the issue are Adobe Flash 11.8.800.168 and IE8.  The same Adobe release works fine with IE9 and also works great with Firefox.  So users on those browser versions would not have been affected.

The good news is … Adobe released an emergency release within 3 days of this problem release.  The new version is 11.8.800.174.  After downloading and installing this version, we were able to see all graphs/charts.   

You can access the latest and previous Adobe Flash versions here …
http://helpx.adobe.com/flash-player/kb/archived-flash-player-versions.html#main_Archived_Flash_Player_versions_for_developers

Good luck.