This post is a part of the PL-300: Microsoft Power BI Data Analyst Exam Prep Hub; and this topic falls under these sections:
Visualize and analyze the data (25–30%)
   --> Create reports
      --> Configure the Report Page

Below are 10 practice questions (with answers and explanations) for this topic of the exam.
There are also 2 practice tests for the PL-300 exam with 60 questions each (with answers) available on the hub.
Practice Questions
Question 1
You are designing a report that will be printed on standard paper. Which report page setting should you configure first?
A. Page background transparency B. Page size C. Visual interactions D. Gridline spacing
Correct Answer:B. Page size
Explanation: When designing reports intended for printing, configuring the page size (such as Letter or custom dimensions) ensures visuals fit the printed format properly. Other settings enhance appearance but do not control layout dimensions.
Question 2
A business user wants all visuals on a page to align evenly without manually adjusting each one. Which feature should you enable?
A. Bookmarks B. Sync slicers C. Gridlines and snap to grid D. Mobile layout
Correct Answer:C. Gridlines and snap to grid
Explanation: Gridlines and snap-to-grid help maintain consistent spacing and alignment across visuals on the report canvas.
Question 3
You want a report page to display well on mobile devices without changing the desktop layout. What should you configure?
A. Page orientation B. Drillthrough filters C. Mobile layout D. Visual headers
Correct Answer:C. Mobile layout
Explanation: The mobile layout allows you to rearrange visuals specifically for phone screens while keeping the desktop view unchanged.
Question 4
A report must comply with accessibility requirements. Which report page configuration supports this requirement?
A. Enabling cross-highlighting B. Adding alt text to visuals C. Using bookmarks D. Changing the page wallpaper
Correct Answer:B. Adding alt text to visuals
Explanation: Alt text enables screen readers to describe visuals to users with visual impairments and is a key accessibility feature in Power BI.
Question 5
You want to guide users to navigate between report pages using buttons. What feature must be configured?
A. Page filters B. Drillthrough C. Bookmarks D. Visual interactions
Correct Answer:C. Bookmarks
Explanation: Bookmarks capture the current report state and can be linked to buttons to create navigation between pages or report views.
Question 6
A report page should use corporate branding colors behind all visuals without interfering with readability. Which setting should you use?
A. Page wallpaper B. Visual border color C. Gridline color D. Data colors
Correct Answer:A. Page wallpaper
Explanation: Wallpaper sits behind the report background and visuals, making it ideal for branding without impacting visual clarity.
Question 7
You need slicers on one report page to affect visuals on another page as well. Which configuration supports this?
A. Page size B. Visual-level filters C. Sync slicers D. Drillthrough
Correct Answer:C. Sync slicers
Explanation: Sync slicers allow slicer selections to be shared across multiple report pages.
Question 8
A report page contains many visuals, but users only need summary information at first. What page-level feature helps improve usability without removing visuals?
A. Hide filter pane B. Drillthrough C. Bookmarks with buttons D. Page background transparency
Correct Answer:C. Bookmarks with buttons
Explanation: Bookmarks can show or hide visuals and allow users to switch between summary and detailed views without cluttering the page.
Question 9
You want a slicer to affect only visuals on the current report page. Where should the filter be configured?
A. Report-level filter B. Visual-level filter C. Page-level filter D. Drillthrough filter
Correct Answer:C. Page-level filter
Explanation: Page-level filters apply only to visuals on the current report page, making them ideal for page-specific filtering.
Question 10
A report designer wants to ensure users can clearly see and interact with visuals without unnecessary distractions. Which configuration best supports this goal?
A. Increase gridline visibility B. Disable visual headers C. Use a simple page layout with consistent spacing D. Apply high-contrast wallpaper
Correct Answer:C. Use a simple page layout with consistent spacing
Explanation: Clear layout, alignment, and spacing improve readability and usability, which is a key objective of report page configuration.
Final Exam Tip
For PL-300, remember that configuring the report page focuses on layout, usability, accessibility, and navigation, not data modeling or DAX. If a question mentions canvas size, layout, navigation, mobile view, or accessibility, it almost always points to this topic.
Division is a common operation in Power BI, but it can cause errors when the divisor is zero. Both DAX and Power Query provide built-in ways to handle these scenarios safely.
Safe DIVIDE in DAX
In DAX, the DIVIDE function is the recommended approach. Its syntax is:
DIVIDE(numerator, divisor [, alternateResult])
If the divisor is zero (or BLANK), the function returns the optional alternateResult; otherwise, it performs the division normally.
Examples:
DIVIDE(10, 2) → 5
DIVIDE(10, 0) → BLANK
DIVIDE(10, 0, 0) → 0
This makes DIVIDE safer and cleaner than using conditional logic.
Safe DIVIDE in Power Query
In Power Query (M language), you can use the try … otherwise expression to handle divide-by-zero errors gracefully. The syntax is:
try [expression] otherwise [alternateValue]
Example:
try [Sales] / [Quantity] otherwise 0
If the division fails (such as when Quantity is zero), Power Query returns 0 instead of an error.
Using DIVIDE in DAX and try … otherwise in Power Query ensures your division calculations remain error-free.
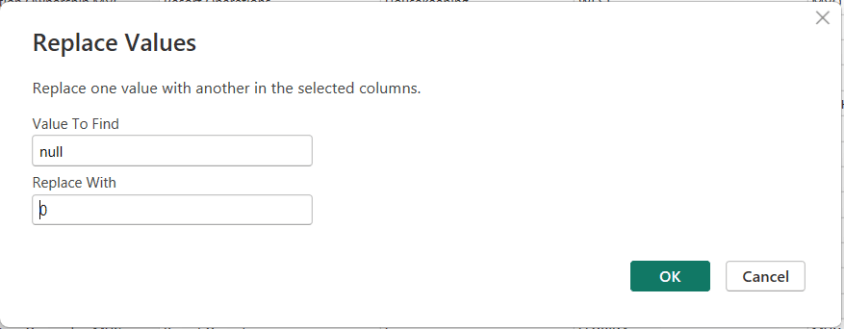
In Power BI, handling NULL values is a common data-preparation step to get your data ready for analysis, and Power Query makes this easy using the Replace Values feature.
This option is available from both the Home menu …
… and the Transform menu in the Power Query Editor.
To replace NULLs, first select the column where the NULL values exist. Then choose Replace Values. When the dialog box appears, enter null as the value to find and replace, and specify the value you want to use instead—such as 0 for numeric columns or “Unknown” for text columns.
After confirming, Power Query automatically updates the column and records the step.
One of the more confusing Power BI errors—especially for intermediate users—is:
“A circular dependency was detected”
This error typically appears when working with DAX measures, calculated columns, calculated tables, relationships, or Power Query transformations. While the message is short, the underlying causes can vary, and resolving it requires understanding how Power BI evaluates dependencies.
This article explains what the error means, common scenarios that cause it, and how to resolve each case.
What Does “Circular Dependency” Mean?
A circular dependency occurs when Power BI cannot determine the correct calculation order because:
Object A depends on B
Object B depends on A (directly or indirectly)
In other words, Power BI is stuck in a loop and cannot decide which calculation should be evaluated first.
Power BI uses a dependency graph behind the scenes to determine evaluation order. When that graph forms a cycle, this error is triggered.
Example of the Error Message
Below is what the error typically looks like in Power BI Desktop:
A circular dependency was detected:
Table[Calculated Column] → Measure[Total Sales] → Table[Calculated Column]
Power BI may list:
Calculated columns
Measures
Tables
Relationships involved in the loop
⚠️ The exact wording varies depending on whether the issue is in DAX, relationships, or Power Query.
Common Scenarios That Cause Circular Dependency Errors
1. Calculated Column Referencing a Measure That Uses the Same Column
Scenario
A calculated column references a measure
That measure aggregates or filters the same table containing the calculated column
Example
-- Calculated Column
Flag =
IF ( [Total Sales] > 1000, "High", "Low" )

-- Measure
Total Sales =
SUM ( Sales[SalesAmount] )
Why This Fails
Calculated columns are evaluated row by row during data refresh
Measures are evaluated at query time
The measure depends on the column, and the column depends on the measure → loop
How to Fix
✅ Replace the measure with row-level logic
Flag =
IF ( Sales[SalesAmount] > 1000, "High", "Low" )
✅ Or convert the calculated column into a measure if aggregation is needed
2. Measures That Indirectly Reference Each Other
Scenario
Two or more measures reference each other through intermediate measures.
Example
Measure A = [Measure B] + 10
Measure B = [Measure A] * 2
Why This Fails
Power BI cannot determine which measure to evaluate first
How to Fix
✅ Redesign logic so one measure is foundational
Base calculations on columns or constants
Avoid bi-directional measure dependencies
Best Practice
Create base measures (e.g., Total Sales, Total Cost)
Build higher-level measures on top of them
3. Calculated Tables Referencing Themselves (Directly or Indirectly)
Artificial Intelligence is shaping nearly every industry, but breaking into AI right out of college can feel overwhelming. The good news is that you don’t need a PhD or years of experience to start a successful AI-related career. Many AI roles are designed specifically for early-career talent, blending technical skills with problem-solving, communication, and business understanding.
This article outlines excellent AI career options for people just entering the workforce, explaining what each role involves, why it’s a strong choice, and how to prepare with the right skills, tools, and learning resources.
1. AI / Machine Learning Engineer (Junior)
What It Is & What It Involves
Machine Learning Engineers build, train, test, and deploy machine learning models. Junior roles typically focus on:
Implementing existing models
Cleaning and preparing data
Running experiments
Supporting senior engineers
Why It’s a Good Option
High demand and strong salary growth
Clear career progression
Central role in AI development
Skills & Preparation Needed
Technical Skills
Python
SQL
Basic statistics & linear algebra
Machine learning fundamentals
Libraries: scikit-learn, TensorFlow, PyTorch
Where to Learn
Coursera (Andrew Ng ML specialization)
Fast.ai
Kaggle projects
University CS or data science coursework
Difficulty Level: ⭐⭐⭐⭐ (Moderate–High)
2. Data Analyst (AI-Enabled)
What It Is & What It Involves
Data Analysts use AI tools to analyze data, generate insights, and support decision-making. Tasks often include:
Data cleaning and visualization
Dashboard creation
Using AI tools to speed up analysis
Communicating insights to stakeholders
Why It’s a Good Option
Very accessible for new graduates
Excellent entry point into AI
Builds strong business and technical foundations
Skills & Preparation Needed
Technical Skills
SQL
Excel
Python (optional but helpful)
Power BI / Tableau
AI tools (ChatGPT, Copilot, AutoML)
Where to Learn
Microsoft Learn
Google Data Analytics Certificate
Kaggle datasets
Internships and entry-level analyst roles
Difficulty Level: ⭐⭐ (Low–Moderate)
3. Prompt Engineer / AI Specialist (Entry Level)
What It Is & What It Involves
Prompt Engineers design, test, and optimize instructions for AI systems to get reliable and accurate outputs. Entry-level roles focus on:
Writing prompts
Testing AI behavior
Improving outputs for business use cases
Supporting AI adoption across teams
Why It’s a Good Option
Low technical barrier
High demand across industries
Great for strong communicators and problem-solvers
Skills & Preparation Needed
Key Skills
Clear writing and communication
Understanding how LLMs work
Logical thinking
Domain knowledge (marketing, analytics, HR, etc.)
Where to Learn
OpenAI documentation
Prompt engineering guides
Hands-on practice with ChatGPT, Claude, Gemini
Real-world experimentation
Difficulty Level: ⭐⭐ (Low–Moderate)
4. AI Product Analyst / Associate Product Manager
What It Is & What It Involves
This role sits between business, engineering, and AI teams. Responsibilities include:
Defining AI features
Translating business needs into AI solutions
Analyzing product performance
Working with data and AI engineers
Why It’s a Good Option
Strong career growth
Less coding than engineering roles
Excellent mix of strategy and technology
Skills & Preparation Needed
Key Skills
Basic AI/ML concepts
Data analysis
Product thinking
Communication and stakeholder management
Where to Learn
Product management bootcamps
AI fundamentals courses
Internships or associate PM roles
Case studies and product simulations
Difficulty Level: ⭐⭐⭐ (Moderate)
5. AI Research Assistant / Junior Data Scientist
What It Is & What It Involves
These roles support AI research and experimentation, often in academic, healthcare, or enterprise environments. Tasks include:
Running experiments
Analyzing model performance
Data exploration
Writing reports and documentation
Why It’s a Good Option
Strong foundation for advanced AI careers
Exposure to real-world research
Great for analytical thinkers
Skills & Preparation Needed
Technical Skills
Python or R
Statistics and probability
Data visualization
ML basics
Where to Learn
University coursework
Research internships
Kaggle competitions
Online ML/statistics courses
Difficulty Level: ⭐⭐⭐⭐ (Moderate–High)
6. AI Operations (AIOps) / ML Operations (MLOps) Associate
What It Is & What It Involves
AIOps/MLOps professionals help deploy, monitor, and maintain AI systems. Entry-level work includes:
Model monitoring
Data pipeline support
Automation
Documentation
Why It’s a Good Option
Growing demand as AI systems scale
Strong alignment with data engineering
Less math-heavy than research roles
Skills & Preparation Needed
Technical Skills
Python
SQL
Cloud basics (Azure, AWS, GCP)
CI/CD concepts
ML lifecycle understanding
Where to Learn
Cloud provider learning paths
MLOps tutorials
GitHub projects
Entry-level data engineering roles
Difficulty Level: ⭐⭐⭐ (Moderate)
7. AI Consultant / AI Business Analyst (Entry Level)
What It Is & What It Involves
AI consultants help organizations understand and implement AI solutions. Entry-level roles focus on:
Use-case analysis
AI tool evaluation
Process improvement
Client communication
Why It’s a Good Option
Exposure to multiple industries
Strong soft-skill development
Fast career progression
Skills & Preparation Needed
Key Skills
Business analysis
AI fundamentals
Presentation and communication
Problem-solving
Where to Learn
Business analytics programs
AI fundamentals courses
Consulting internships
Case study practice
Difficulty Level: ⭐⭐⭐ (Moderate)
8. AI Content & Automation Specialist
What It Is & What It Involves
This role focuses on using AI to automate content, workflows, and internal processes. Tasks include:
Building automations
Creating AI-generated content
Managing tools like Zapier, Notion AI, Copilot
Why It’s a Good Option
Very accessible for non-technical graduates
High demand in marketing and operations
Rapid skill acquisition
Skills & Preparation Needed
Key Skills
Workflow automation
AI tools usage
Creativity and organization
Basic scripting (optional)
Where to Learn
Zapier and Make tutorials
Hands-on projects
YouTube and online courses
Real business use cases
Difficulty Level: ⭐⭐ (Low–Moderate)
How New Graduates Should Prepare for AI Careers
1. Build Foundations
Python or SQL
Data literacy
AI concepts (not just tools)
2. Practice with Real Projects
Personal projects
Internships
Freelance or volunteer work
Kaggle or GitHub portfolios
3. Learn AI Tools Early
ChatGPT, Copilot, Gemini
AutoML platforms
Visualization and automation tools
4. Focus on Communication
AI careers, and careers in general, reward those who can explain complex ideas simply.
Final Thoughts
AI careers are no longer limited to researchers or elite engineers. For early-career professionals, the best path is often a hybrid role that combines AI tools, data, and business understanding. Starting in these roles builds confidence, experience, and optionality—allowing you to grow into more specialized AI positions over time. And the advice that many professionals give for gaining knowledge and breaking into the space is to “get your hands dirty”.
This is your one-stop hub with information for preparing for the DP-600: Implementing Analytics Solutions Using Microsoft Fabric certification exam. Upon successful completion of the exam, you earn the Fabric Analytics Engineer Associate certification.
This hub provides information directly here, links to a number of external resources, tips for preparing for the exam, practice tests, and section questions to help you prepare. Bookmark this page and use it as a guide to ensure that you are fully covering all relevant topics for the exam and using as many of the resources available as possible. We hope you find it convenient and helpful.
Why do the DP-600: Implementing Analytics Solutions Using Microsoft Fabric exam to gain the Fabric Analytics Engineer Associate certification?
Most likely, you already know why you want to earn this certification, but in case you are seeking information on its benefits, here are a few: (1) there is a possibility for career advancement because Microsoft Fabric is a leading data platform used by companies of all sizes, all over the world, and is likely to become even more popular (2) greater job opportunities due to the edge provided by the certification (3) higher earnings potential, (4) you will expand your knowledge about the Fabric platform by going beyond what you would normally do on the job and (5) it will provide immediate credibility about your knowledge, and (6) it may, and it should, provide you with greater confidence about your knowledge and skills.
Important DP-600 resources:
In the section below this one, titled “DP-600: Skills measured as of October 31, 2025“, you will find the “skills measured” topics from the official study guide with links to exam preparation content for each topic. Bookmark this page and use that section as a structured topic-by-topic guide for your prep.
This page provides information for preparing for, practicing for, and registering for the exam. The skills measured content in the guide is also what is used to form the “Skills Measured as of …” outline below.
About the exam:
Cost: US $165
Number of questions: approximately 60
Time to do exam: 120 minutes (2 hours)
To Do’s:
Schedule time to learn, study, perform labs, and do practice exams and questions
Schedule the exam based on when you think you will be ready; scheduling the exam gives you a target and drives you to keep working on it
Use the various resources above and below to learn
Take the free Microsoft Learn practice test, any other available practice tests, and do the practice questions in each section and the two practice tests available in this hub.
Link to the free, comprehensive, self-paced course: Microsoft Learn course for a Microsoft Fabric Analytics Engineer. It contains 4 Learning Paths, each with multiple Modules, and each module has multiple Units. It will take some time to do it, but we recommend that you complete this entire course, including the exercises/labs. To help you work through your preparation in a structured manner, we will point you to the relevant sections in the training material corresponding to each of the sections in the skills measured section below.
Here you can learn in a structured manner by going through the topics of the exam one-by-one to ensure full coverage; click on each hyperlinked topic below to go to more information about it:
Good luck to you passing the DP-600: Implementing Analytics Solutions Using Microsoft Fabric certification exam and earning the Fabric Analytics Engineer Associate certification!
This is a practice exam for the DP-600: Implementing Analytics Solutions Using Microsoft Fabric certification exam. – It contains: 60 Questions (the questions are of varying type and difficulty) – The answer key is located: at the end of the exam; i.e., after all the questions. We recommend that you try to answer the questions before looking at the answers. – Upon successful completion of the official certification exam, you earn the Fabric Analytics Engineer Associate certification.
Good luck to you!
Section A – Prepare Data (1–24)
Question 1 (Single Choice)
You need to ingest semi-structured JSON files from Azure Blob Storage into a Fabric Lakehouse and apply light transformations using a graphical interface. What is the best tool?
A. Spark notebook B. SQL endpoint C. Dataflow Gen2 D. Eventstream
Question 2 (Multi-Select)
Which operations are best performed in Power Query during data preparation? (Choose 2)
A. Removing duplicates B. Creating DAX measures C. Changing column data types D. Creating calculation groups E. Managing relationships
Question 3 (Single Choice)
Which Fabric feature allows you to reference data stored in another workspace without copying it?
A. Pipeline B. Dataflow Gen2 C. Shortcut D. Deployment rule
Question 4 (Single Choice)
Which statement about OneLake is correct?
A. It only supports structured data B. It replaces Azure Data Lake Gen2 C. It provides a single logical data lake across Fabric D. It only supports Power BI datasets
Question 5 (Matching)
Match the Fabric item to its primary use case:
Item
Use Case
1. Warehouse
A. Streaming analytics
2. Lakehouse
B. Open data + Spark
3. Eventhouse
C. Relational SQL analytics
Question 6 (Single Choice)
You are analyzing IoT telemetry data with time-based aggregation requirements. Which query language is most appropriate?
A. SQL B. DAX C. KQL D. MDX
Question 7 (Single Choice)
Which transformation is most likely to prevent query folding?
A. Filtering rows B. Removing columns C. Merging queries using a fuzzy match D. Sorting data
Question 8 (Multi-Select)
What are benefits of using Dataflow Gen2? (Choose 2)
A. Reusable transformations B. High-concurrency reporting C. Centralized data preparation D. DAX calculation optimization E. XMLA endpoint access
Question 9 (Single Choice)
Which file format is optimized for Direct Lake access?
A. CSV B. JSON C. Parquet D. Excel
Question 10 (Fill in the Blank)
Incremental refresh requires two parameters named __________ and __________.
Question 11 (Single Choice)
You want to aggregate data at ingestion time to reduce dataset size. Where should this occur?
A. Power BI visuals B. DAX measures C. Power Query D. Report filters
Question 12 (Multi-Select)
Which characteristics describe a star schema? (Choose 2)
A. Central fact table B. Snowflaked dimensions C. Denormalized dimensions D. Many-to-many relationships by default E. High cardinality dimensions
Question 13 (Single Choice)
Which action most negatively impacts VertiPaq compression?
A. Using integers instead of strings B. Reducing cardinality C. Using calculated columns D. Sorting dimension tables
Question 14 (Single Choice)
Which Fabric feature provides end-to-end data lineage visibility?
A. Deployment pipelines B. Impact analysis C. Lineage view D. Git integration
Question 15 (Single Choice)
What is the primary purpose of Detect data changes in incremental refresh?
A. Reduce model size B. Trigger refresh only when data changes C. Enforce referential integrity D. Improve DAX performance
Question 16 (Single Choice)
Which Fabric item supports both Spark and SQL querying of the same data?
A. Warehouse B. Eventhouse C. Lakehouse D. Semantic model
Question 17 (Multi-Select)
Which scenarios justify using Spark notebooks? (Choose 2)
A. Complex transformations B. Streaming ingestion C. Simple joins D. Machine learning workflows E. Report filtering
Question 18 (Single Choice)
Which query type is most efficient for large-scale aggregations on relational data?
A. DAX B. SQL C. M D. Python
Question 19 (Single Choice)
Which Fabric feature enables schema-on-read?
A. Warehouse B. Lakehouse C. Semantic model D. SQL endpoint
Question 20 (Single Choice)
Which approach preserves historical dimension values?
A. Type 1 SCD B. Type 2 SCD C. Snapshot fact table D. Slowly changing fact
Question 21 (Single Choice)
Which tool helps identify downstream impact before changing a dataset?
A. Lineage view B. Performance Analyzer C. Impact analysis D. DAX Studio
Question 22 (Multi-Select)
Which actions reduce data duplication in Fabric? (Choose 2)
A. Shortcuts B. Import mode only C. Shared semantic models D. Calculated tables E. Composite models
Question 23 (Single Choice)
Which Fabric artifact is best for structured reporting with high concurrency?
A. Lakehouse B. Warehouse C. Eventhouse D. Dataflow Gen2
Question 24 (Single Choice)
Which file format is recommended for sharing a Power BI report without data?
A. PBIX B. CSV C. PBIT D. PBIP
Section B – Semantic Models (25–48)
Question 25 (Single Choice)
Which storage mode offers the fastest query performance?
A. DirectQuery B. Direct Lake C. Import D. Composite
Question 26 (Single Choice)
When should you use a bridge table?
A. One-to-many relationships B. Many-to-many relationships C. One-to-one relationships D. Hierarchical dimensions
Question 27 (Multi-Select)
What are characteristics of composite models? (Choose 2)
A. Mix Import and DirectQuery B. Enable aggregations C. Require XMLA write access D. Eliminate refresh needs E. Only supported in Premium
Question 28 (Single Choice)
Which DAX function changes filter context?
A. SUM B. AVERAGE C. CALCULATE D. COUNT
Question 29 (Single Choice)
Which feature allows users to dynamically switch measures in visuals?
A. Calculation groups B. Field parameters C. Perspectives D. Drillthrough
Question 30 (Single Choice)
Which DAX pattern is least performant?
A. SUM B. SUMX over large tables C. COUNT D. DISTINCTCOUNT on low cardinality
Question 31 (Multi-Select)
Which improve DAX performance? (Choose 2)
A. Reduce cardinality B. Use variables C. Increase calculated columns D. Use iterators everywhere E. Disable relationships
Question 32 (Single Choice)
What is the primary purpose of calculation groups?
A. Reduce model size B. Apply calculations dynamically C. Create new tables D. Improve refresh speed
Question 33 (Single Choice)
Which tool helps identify slow visuals?
A. DAX Studio B. SQL Profiler C. Performance Analyzer D. Lineage view
Question 34 (Single Choice)
Which storage mode supports fallback behavior?
A. Import B. DirectQuery C. Direct Lake D. Composite
Question 35 (Single Choice)
Which feature supports version control of semantic models?
A. Deployment pipelines B. Endorsement C. Git integration D. Sensitivity labels
Question 36 (Matching)
Match the DAX function to its category:
Function
Category
1. FILTER
A. Aggregation
2. SUMX
B. Iterator
3. SELECTEDVALUE
C. Information
Question 37 (Single Choice)
Which table type supports hot and cold partitions?
A. Import B. DirectQuery C. Hybrid D. Calculated
Question 38 (Single Choice)
Which relationship direction is recommended in star schemas?
A. Both B. Single C. None D. Many
Question 39 (Multi-Select)
Which actions reduce semantic model size? (Choose 2)
A. Remove unused columns B. Use integers for keys C. Increase precision of decimals D. Add calculated tables E. Duplicate dimensions
Question 40 (Single Choice)
Which feature allows formatting measures dynamically?
A. Field parameters B. Dynamic format strings C. Perspectives D. Drillthrough
Question 41 (Single Choice)
Which model type allows real-time and cached data together?
A. Import B. Hybrid C. DirectQuery D. Calculated
Question 42 (Fill in the Blank)
Direct Lake queries data stored as __________ tables in __________.
Question 43 (Single Choice)
Which model design supports aggregations with fallback to detail data?
A. Import B. Composite C. DirectQuery D. Calculated
Question 44 (Single Choice)
Which feature resolves many-to-many relationships cleanly?
A. Bi-directional filters B. Bridge tables C. Calculated columns D. Dynamic measures
Question 45 (Single Choice)
Which DAX function returns the current filter context value?
A. VALUES B. ALL C. SELECTEDVALUE D. HASONEVALUE
Question 46 (Multi-Select)
Which scenarios justify large semantic model storage? (Choose 2)
A. Billions of rows B. Memory limits exceeded C. Small datasets D. Few dimensions E. Simple models
Question 47 (Single Choice)
Which optimization reduces query complexity?
A. Snowflake schemas B. Denormalization C. Many-to-many relationships D. Bi-directional filters
Question 48 (Single Choice)
What determines incremental refresh partition updates?
A. Refresh frequency B. Date filters C. Detect data changes D. Report usage
Section C – Maintain & Govern (49–60)
Question 49 (Single Choice)
Who can configure tenant-level Fabric settings?
A. Workspace Admin B. Capacity Admin C. Fabric Admin D. Contributor
Question 50 (Multi-Select)
Which features support governance? (Choose 2)
A. Sensitivity labels B. Endorsement C. Performance Analyzer D. RLS E. Field parameters
Question 51 (Single Choice)
Which endorsement indicates organization-wide trust?
A. Certified B. Promoted C. Shared D. Published
Question 52 (Single Choice)
Which deployment stage is used for validation?
A. Development B. Test C. Production D. Workspace
Question 53 (Single Choice)
Which permission allows modifying a semantic model?
A. Viewer B. Contributor C. Admin D. Reader
Question 54 (Single Choice)
Which feature shows affected reports when changing a model?
A. Lineage view B. Impact analysis C. Deployment rules D. Git history
Question 55 (Multi-Select)
Which actions improve security? (Choose 2)
A. Row-level security B. Object-level security C. Calculated columns D. Field parameters E. Dynamic measures
Question 56 (Single Choice)
Who can delete a Fabric workspace?
A. Member B. Contributor C. Admin D. Viewer
Question 57 (Fill in the Blank)
Restricting rows based on user identity is called __________ security.
Question 58 (Single Choice)
Which format enables source control–friendly Power BI projects?
A. PBIX B. PBIP C. PBIT D. CSV
Question 59 (Single Choice)
Which feature classifies data sensitivity?
A. Endorsement B. Sensitivity labels C. RLS D. Deployment pipelines
Question 60 (Single Choice)
Which feature supports controlled promotion between environments?
A. Git integration B. Lineage view C. Deployment pipelines D. Shortcuts
✅ ANSWER KEY WITH EXPLANATIONS
(Concise explanations provided; incorrect options explained where relevant)
1. C – Dataflow Gen2
Low-code ingestion and transformation for semi-structured data.
2. A, C
Power Query handles data cleansing and type conversion.
This post is a part of the DP-600: Implementing Analytics Solutions Using Microsoft Fabric Exam Prep Hub; and this topic falls under these sections:
Implement and manage semantic models (25-30%)
    --> Optimize enterprise-scale semantic models
        --> Implement performance improvements in queries and report visuals
Performance optimization is a critical skill for the Fabric Analytics Engineer. In enterprise-scale semantic models, poor query design, inefficient DAX, or overly complex visuals can significantly degrade report responsiveness and user experience. This exam section focuses on identifying performance bottlenecks and applying best practices to improve query execution, model efficiency, and report rendering.
1. Understand Where Performance Issues Occur
Performance problems typically fall into three layers:
a. Data & Storage Layer
Storage mode (Import, DirectQuery, Direct Lake, Composite)
Data source latency
Table size and cardinality
Partitioning and refresh strategies
b. Semantic Model & Query Layer
DAX calculation complexity
Relationships and filter propagation
Aggregation design
Use of calculation groups and measures
c. Report & Visual Layer
Number and type of visuals
Cross-filtering behavior
Visual-level queries
Use of slicers and filters
DP-600 questions often test your ability to identify the correct layer where optimization is needed.
2. Optimize Queries and Semantic Model Performance
a. Choose the Appropriate Storage Mode
Use Import for small-to-medium datasets requiring fast interactivity
Use Direct Lake for large OneLake Delta tables with high concurrency
Use Composite models to balance performance and real-time access
Avoid unnecessary DirectQuery when Import or Direct Lake is feasible
b. Reduce Data Volume
Remove unused columns and tables
Reduce column cardinality (e.g., avoid high-cardinality text columns)
Prefer surrogate keys over natural keys
Disable Auto Date/Time when not needed
c. Optimize Relationships
Use single-direction relationships by default
Avoid unnecessary bidirectional filters
Ensure relationships follow a star schema
Avoid many-to-many relationships unless required
d. Use Aggregations
Create aggregation tables to pre-summarize large fact tables
Enable query hits against aggregation tables before scanning detailed data
Especially valuable in composite models
3. Improve DAX Query Performance
a. Write Efficient DAX
Prefer measures over calculated columns
Use variables (VAR) to avoid repeated calculations
Minimize row context where possible
Avoid excessive iterators (SUMX, FILTER) over large tables
b. Use Filter Context Efficiently
Prefer CALCULATE with simple filters
Avoid complex nested FILTER expressions
Use KEEPFILTERS and REMOVEFILTERS intentionally
c. Avoid Expensive Patterns
Avoid EARLIER in favor of variables
Avoid dynamic table generation inside visuals
Minimize use of ALL when ALLSELECTED or scoped filters suffice
4. Optimize Report Visual Performance
a. Reduce Visual Complexity
Limit the number of visuals per page
Avoid visuals that generate multiple queries (e.g., complex custom visuals)
Use summary visuals instead of detailed tables where possible
b. Control Interactions
Disable unnecessary visual interactions
Avoid excessive cross-highlighting
Use report-level filters instead of visual-level filters when possible
c. Optimize Slicers
Avoid slicers on high-cardinality columns
Use dropdown slicers instead of list slicers
Limit the number of slicers on a page
d. Prefer Measures Over Visual Calculations
Avoid implicit measures created by dragging numeric columns
Define explicit measures in the semantic model
Reuse measures across visuals to improve cache efficiency
5. Use Performance Analysis Tools
a. Performance Analyzer
Identify slow visuals
Measure DAX query duration
Distinguish between query time and visual rendering time
b. Query Diagnostics (Power BI Desktop)
Analyze backend query behavior
Identify expensive DirectQuery or Direct Lake operations
c. DAX Studio (Advanced)
Analyze query plans
Measure storage engine vs formula engine time
Identify inefficient DAX patterns
(You won’t be tested on tool UI details, but knowing when and why to use them is exam-relevant.)
6. Common DP-600 Exam Scenarios
You may be asked to:
Identify why a report is slow and choose the best optimization
Identify the bottleneck layer (model, query, or visual)
Select the most appropriate storage mode for performance
Choose the least disruptive, most effective optimization
Improve a slow DAX measure
Reduce visual rendering time without changing the data source
Optimize performance for enterprise-scale models
Apply enterprise-scale best practices, not just quick fixes
Key Exam Takeaways
Always optimize the model first, visuals second
Star schema + clean relationships = better performance
Efficient DAX matters more than clever DAX
Fewer visuals and interactions = faster reports
Aggregations and Direct Lake are key enterprise-scale tools
A composite model in Power BI and Microsoft Fabric combines data from multiple data sources and multiple storage modes in a single semantic model. Rather than importing all data into the model’s in-memory cache, composite models let you mix different query/storage patterns such as:
Import
DirectQuery
Direct Lake
Live connections
Composite models enable flexible design and optimized performance across diverse scenarios.
Why Composite Models Matter
Semantic models often need to support:
Large datasets that cannot be imported fully
Real-time or near-real-time requirements
Federation across disparate sources
Mix of highly dynamic and relatively static data
Composite models let you combine the benefits of in-memory performance with direct source access.
Core Concepts
Storage Modes in Composite Models
Storage Mode
Description
Typical Use
Import
Data is cached in the semantic model memory
Fast performance for static or moderately sized data
DirectQuery
Queries are pushed to the source at runtime
Real-time or large relational sources
Direct Lake
Queries Delta tables in OneLake
Large OneLake data with faster interactive access
Live Connection
Delegates all query processing to an external model
Shared enterprise semantic models
A composite model may include tables using different modes — for example, imported dimension tables and DirectQuery/Direct Lake fact tables.
Key Features of Composite Models
1. Table-Level Storage Modes
Every table in a composite model may use a different storage mode:
Dimensions may be imported
Fact tables may use DirectQuery or Direct Lake
Bridge or helper tables may be imported
This flexibility enables performance and freshness trade-offs.
2. Relationships Across Storage Modes
Relationships can span tables even if they use different storage modes, enabling:
Filtering between imported and DirectQuery tables
Cross-mode joins (handled intelligently by the engine)
Underlying engines push queries to the appropriate source (SQL, OneLake, Semantic layer), depending on where the data resides.
3. Aggregations and Hierarchies
You can define:
Aggregated tables (pre-summarized import tables)
Detail tables (DirectQuery or Direct Lake)
Power BI automatically uses aggregations when a visual’s query can be satisfied with summary data, enhancing performance.
4. Calculation Groups and Measures
Composite models work with complex semantic logic:
Calculation groups (standardized transformations)
DAX measures that span imported and DirectQuery tables
These models require careful modeling to ensure that context transitions behave predictably.
When to Use Composite Models
Composite models are ideal when:
A. Data Is Too Large to Import
Large fact tables (> hundreds of millions of rows)
Delta/OneLake data too big for full in-memory import
Use Direct Lake for these, while importing dimensions
B. Real-Time Data Is Required
Operational reporting
Systems with high update frequency
Use DirectQuery to relational sources
C. Multiple Data Sources Must Be Combined
Relational databases
OneLake & Delta
Cloud services (e.g., Synapse, SQL DB, Spark)
On-prem gateways
Composite models let you combine these seamlessly.
D. Different Performance vs Freshness Needs
Import for static master data
DirectQuery or Direct Lake for dynamic fact data
Composite vs Pure Models
Aspect
Import Only
Composite
Performance
Very fast
Depends on source/query pattern
Freshness
Scheduled refresh
Real-time/near-real-time possible
Source diversity
Limited
Multiple heterogeneous sources
Model complexity
Simpler
Higher
Query Execution and Optimization
Query Folding
DirectQuery and Power Query transformations rely on query folding to push logic back to the source
Query folding is essential for performance in composite models
Storage Mode Selection
Good modeling practices for composite models include:
Import small dimension tables
Direct Lake for large storage in OneLake
DirectQuery for real-time relational sources
Use aggregations to optimize performance
Modeling Considerations
1. Relationship Direction
Prefer single-direction relationships
Use bidirectional filtering only when required (careful with ambiguity)
2. Data Type Consistency
Ensure fields used in joins have matching data types
In composite models, mismatches can cause query fallbacks
3. Cardinality
High cardinality DirectQuery columns can slow queries
Use star schema patterns
4. Security
Row-level security crosses modes but must be carefully tested
Security logic must consider where filters are applied
Common Exam Scenarios
Exam questions may ask you to:
Choose between Import, DirectQuery, Direct Lake and composite
Assess performance vs freshness requirements
Determine query folding feasibility
Identify correct relationship patterns across modes
Example prompt:
“Your model combines a large OneLake dataset and a small dimension table. Users need current data daily but also fast filtering. Which storage and modeling approach is best?”
Correct exam choices often point to composite models using Direct Lake + imported dimensions.
Best Practices
Define a clear star schema even in composite models
Import dimension tables where reasonable
Use aggregations to improve performance for heavy visuals
Limit direct many-to-many relationships
Use calculation groups to apply analytics consistently
Test query performance across storage modes
Exam-Ready Summary/Tips
Composite models enable flexible and scalable semantic models by mixing storage modes:
Import – best performance for static or moderate data
DirectQuery – real-time access to source systems
Direct Lake – scalable querying of OneLake Delta data
Live Connection – federated or shared datasets
Design composite models to balance performance, freshness, and data volume, using strong schema design and query optimization.
For DP-600, always evaluate:
Data volume
Freshness requirements
Performance expectations
Source location (OneLake vs relational)
Composite models are frequently the correct answer when these requirements conflict.
Practice Questions:
Here are 10 questions to test and help solidify your learning and knowledge. As you review these and other questions in your preparation, make sure to …
Identifying and understand why an option is correct (or incorrect) — not just which one
Look for and understand the usage scenario of keywords in exam questions to guide you
Expect scenario-based questions rather than direct definitions
1. What is the primary purpose of using a composite model in Microsoft Fabric?
A. To enable row-level security across workspaces B. To combine multiple storage modes and data sources in one semantic model C. To replace DirectQuery with Import mode D. To enforce star schema design automatically
✅ Correct Answer: B
Explanation: Composite models allow you to mix Import, DirectQuery, Direct Lake, and Live connections within a single semantic model, enabling flexible performance and data-freshness tradeoffs.
2. You are designing a semantic model with a very large fact table stored in OneLake and small dimension tables. Which storage mode combination is most appropriate?
A. Import all tables B. DirectQuery for all tables C. Direct Lake for the fact table and Import for dimension tables D. Live connection for the fact table and Import for dimensions
✅ Correct Answer: C
Explanation: Direct Lake is optimized for querying large Delta tables in OneLake, while importing small dimension tables improves performance for filtering and joins.
3. Which storage mode allows querying OneLake Delta tables without importing data into memory?
A. Import B. DirectQuery C. Direct Lake D. Live Connection
✅ Correct Answer: C
Explanation: Direct Lake queries Delta tables directly in OneLake, combining scalability with better interactive performance than traditional DirectQuery.
4. What happens when a DAX query in a composite model references both imported and DirectQuery tables?
A. The query fails B. The data must be fully imported C. The engine generates a hybrid query plan D. All tables are treated as DirectQuery
✅ Correct Answer: C
Explanation: Power BI’s engine generates a hybrid query plan, pushing operations to the source where possible and combining results with in-memory data.
5. Which scenario most strongly justifies using a composite model instead of Import mode only?
A. All data fits in memory and refreshes nightly B. The dataset is static and small C. Users require near-real-time data from a large relational source D. The model contains only calculated tables
✅ Correct Answer: C
Explanation: Composite models are ideal when real-time or near-real-time access is needed, especially for large datasets that are impractical to import.
6. In a composite model, which table type is typically best suited for Import mode?
A. High-volume transactional fact tables B. Streaming event tables C. Dimension tables with low cardinality D. Tables requiring second-by-second freshness
✅ Correct Answer: C
Explanation: Importing dimension tables improves query performance and reduces load on source systems due to their relatively small size and low volatility.
7. How do aggregation tables improve performance in composite models?
A. By replacing DirectQuery with Import B. By pre-summarizing data to satisfy queries without scanning detail tables C. By eliminating the need for relationships D. By enabling bidirectional filtering automatically
✅ Correct Answer: B
Explanation: Aggregations allow Power BI to answer queries using pre-summarized Import tables, avoiding expensive queries against large DirectQuery or Direct Lake fact tables.
8. Which modeling pattern is strongly recommended when designing composite models?
A. Snowflake schema B. Flat tables C. Star schema D. Many-to-many relationships
✅ Correct Answer: C
Explanation: A star schema simplifies relationships, improves performance, and reduces ambiguity—especially important in composite and cross-storage-mode models.
9. What is a potential risk of excessive bidirectional relationships in composite models?
A. Reduced data freshness B. Increased memory consumption C. Ambiguous filter paths and unpredictable query behavior D. Loss of row-level security
✅ Correct Answer: C
Explanation: Bidirectional relationships can introduce ambiguity, cause unexpected filtering, and negatively affect query performance—risks that are amplified in composite models.
10. Which feature allows a composite model to reuse an enterprise semantic model while extending it with additional data?
A. Direct Lake B. Import mode C. Live connection with local tables D. Calculation groups
✅ Correct Answer: C
Explanation: A live connection with local tables enables extending a shared enterprise semantic model by adding new tables and measures, forming a composite model.
This post is a part of the DP-600: Implementing Analytics Solutions Using Microsoft Fabric Exam Prep Hub; and this topic falls under these sections:
Implement and manage semantic models (25-30%)
    --> Design and build semantic models
        --> Implement Calculation Groups, Dynamic Format Strings,
            and Field Parameters
This topic evaluates your ability to design flexible, scalable, and user-friendly semantic models by reducing measure sprawl, improving report interactivity, and standardizing calculations. These techniques are especially important in enterprise-scale Fabric semantic models.
1. Calculation Groups
What Are Calculation Groups?
Calculation groups allow you to apply a single calculation logic to multiple measures without duplicating DAX. Instead of creating many similar measures (e.g., YTD Sales, YTD Profit, YTD Margin), you define the logic once and apply it dynamically.
Calculation groups are implemented in:
Power BI Desktop (Model view)
Tabular Editor (recommended for advanced scenarios)
Common Use Cases
Time intelligence (YTD, MTD, QTD, Prior Year)
Currency conversion
Scenario analysis (Actual vs Budget vs Forecast)
Mathematical transformations (e.g., % of total)
Key Concepts
Calculation Item: A single transformation (e.g., YTD)
SELECTEDMEASURE(): References the currently evaluated measure
Precedence: Controls evaluation order when multiple calculation groups exist
Switching between time granularity (Year, Quarter, Month)
Reducing report clutter while increasing flexibility
How They Work
Field parameters:
Generate a hidden table
Are used in slicers
Dynamically change the field used in visuals
Example
A single bar chart can switch between:
Sales Amount
Profit
Profit Margin
Based on the slicer selection.
Exam Tips
Field parameters are report-layer features, not DAX logic
They do not affect data storage or model size
Often paired with calculation groups for advanced analytics
4. How These Features Work Together
In real-world Fabric semantic models, these three features are often combined:
Feature
Purpose
Calculation Groups
Apply reusable logic
Dynamic Format Strings
Ensure correct formatting
Field Parameters
Enable user-driven analysis
Example Scenario
A report allows users to:
Select a metric (field parameter)
Apply time intelligence (calculation group)
Automatically display correct formatting (dynamic format string)
This design is highly efficient, scalable, and exam-relevant.
Key Exam Takeaways
Calculation groups reduce measure duplication; Calculation groups = reuse logic
SELECTEDMEASURE() is central to calculation groups
Dynamic format strings affect display, not values; Dynamic format strings = display control
Field parameters increase report interactivity; Field parameters = user-driven interactivity
These features are commonly tested together
Practice Questions:
Here are 10 questions to test and help solidify your learning and knowledge. As you review these and other questions in your preparation, make sure to …
Identifying and understand why an option is correct (or incorrect) — not just which one
Look for and understand the usage scenario of keywords in exam questions to guide you
Expect scenario-based questions rather than direct definitions
Question 1
What is the primary benefit of using calculation groups in a semantic model?
A. They improve data refresh performance B. They reduce the number of fact tables C. They allow reusable calculations to be applied to multiple measures D. They automatically optimize DAX queries
Correct Answer: C
Explanation: Calculation groups let you define a calculation once (for example, YTD) and apply it to many measures using SELECTEDMEASURE(), reducing measure duplication and improving maintainability.
Question 2
Which DAX function is essential when defining a calculation item in a calculation group?
A. CALCULATE() B. SELECTEDVALUE() C. SELECTEDMEASURE() D. VALUES()
Correct Answer: C
Explanation: SELECTEDMEASURE() dynamically references the measure currently being evaluated, which is fundamental to how calculation groups work.
Question 3
Where can calculation groups be created?
A. Power BI Service only B. Power BI Desktop Model view or Tabular Editor C. Power Query Editor D. SQL endpoint in Fabric
Correct Answer: B
Explanation: Calculation groups are created in Power BI Desktop (Model view) or using external tools like Tabular Editor. They cannot be created in the Power BI Service.
Question 4
What happens if two calculation groups affect the same measure?
A. The measure fails to evaluate B. The calculation group with the highest precedence is applied first C. Both calculations are ignored D. The calculation group created most recently is applied
Correct Answer: B
Explanation: Calculation group precedence determines the order of evaluation when multiple calculation groups apply to the same measure.
Question 5
What is the purpose of dynamic format strings?
A. To change the data type of a column B. To modify measure values at query time C. To change how values are displayed based on context D. To improve query performance
Correct Answer: C
Explanation: Dynamic format strings control how a measure is displayed (currency, percentage, decimals) without changing the underlying numeric value.
Question 6
Which statement about dynamic format strings is TRUE?
A. They change the stored data in the model B. They require Power Query transformations C. They can be driven by calculation group selections D. They only apply to calculated columns
Correct Answer: C
Explanation: Dynamic format strings are often used alongside calculation groups to ensure values are formatted correctly depending on the applied calculation.
Question 7
What problem do field parameters primarily solve?
A. Reducing model size B. Improving data refresh speed C. Allowing users to switch fields in visuals dynamically D. Enforcing row-level security
Correct Answer: C
Explanation: Field parameters enable report consumers to dynamically change measures or dimensions in visuals using slicers, improving report flexibility.
Question 8
When you create a field parameter in Power BI Desktop, what is generated automatically?
A. A calculated column B. A hidden parameter table C. A new measure D. A new semantic model
Correct Answer: B
Explanation: Power BI creates a hidden table that contains the selectable fields used by the field parameter slicer.
Question 9
Which feature is considered a report-layer feature rather than a modeling or DAX feature?
A. Calculation groups B. Dynamic format strings C. Field parameters D. Measures using iterators
Correct Answer: C
Explanation: Field parameters are primarily a report authoring feature that affects visuals and slicers, not the underlying model logic.
Question 10
Which combination provides the most scalable and flexible semantic model design?
A. Calculated columns and filters B. Multiple duplicated measures C. Calculation groups, dynamic format strings, and field parameters D. Import mode and DirectQuery
Correct Answer: C
Explanation: Using calculation groups for reusable logic, dynamic format strings for display control, and field parameters for interactivity creates scalable, maintainable, and user-friendly semantic models.
Information and resources for the data professionals' community