Category: Data Visualization

Configure Direct Lake, including default fallback and refresh behavior

This post is a part of the DP-600: Implementing Analytics Solutions Using Microsoft Fabric Exam Prep Hub; and this topic falls under these sections: 
Implement and manage semantic models (25-30%)
--> Optimize enterprise-scale semantic models
--> Configure Direct Lake, including default fallback and refresh behavior

Overview

Direct Lake is a storage and connectivity mode in Microsoft Fabric semantic models that enables Power BI to query data directly from OneLake without importing data into VertiPaq or sending queries back to the data source (as in DirectQuery). It is designed to deliver near–Import performance with DirectQuery-like freshness, making it a key feature for enterprise-scale analytics.

For the DP-600 exam, you are expected to understand:

  • How Direct Lake works
  • When and why fallback occurs
  • How default fallback behavior is configured
  • How refresh behaves in Direct Lake models
  • Common performance and design considerations

How Direct Lake Works

In Direct Lake mode:

  • Data resides in Delta tables stored in OneLake (typically from a Lakehouse or Warehouse).
  • The semantic model reads Parquet/Delta files directly, bypassing data import.
  • Metadata and file statistics are cached to optimize query performance.
  • Queries are executed without duplicating data into VertiPaq storage.

This architecture reduces data duplication while still enabling fast, interactive analytics.


Default Fallback Behavior

What Is Direct Lake Fallback?

Fallback occurs when a query or operation cannot be executed using Direct Lake. In these cases, the semantic model automatically falls back to another mode to ensure the query still returns results.

Depending on configuration, fallback may occur to:

  • DirectQuery, or
  • Import (VertiPaq), if data is available

Fallback is automatic and transparent to report users unless explicitly restricted.


Common Causes of Fallback

Direct Lake fallback can be triggered by:

  • Unsupported DAX functions or expressions
  • Unsupported data types in Delta tables
  • Complex model features (certain calculation patterns, security scenarios)
  • Queries that cannot be resolved efficiently using file-based access
  • Temporary unavailability of OneLake files

Understanding these triggers is important for diagnosing performance issues.


Configuring Default Fallback Behavior

In Fabric semantic model settings, you can configure:

  • Allow fallback (default) – Ensures queries continue to work even when Direct Lake is not supported.
  • Disable fallback – Queries fail instead of falling back, which is useful for enforcing performance expectations or testing Direct Lake compatibility.

From an exam perspective:

  • Allowing fallback prioritizes reliability
  • Disabling fallback prioritizes predictability and performance validation

Refresh Behavior in Direct Lake Models

Do Direct Lake Models Require Refresh?

Unlike Import mode:

  • Direct Lake does not require scheduled data refresh to reflect new data in OneLake.
  • New or updated Delta files are automatically visible to the semantic model.

However, metadata refreshes are still relevant.


Types of Refresh in Direct Lake

  1. Metadata Refresh
    • Updates table schemas, partitions, and statistics
    • Required when:
      • Columns are added or removed
      • Table structures change
    • Lightweight compared to Import refresh
  2. Hybrid Scenarios
    • If fallback to Import is enabled and used, those imported parts do require refresh
    • Mixed behavior may exist in composite or fallback-heavy models

Impact of Refresh on Performance

  • No large-scale data movement during refresh
  • Faster model readiness after schema changes
  • Reduced refresh windows compared to Import models
  • Lower memory pressure in capacity

This makes Direct Lake especially suitable for large, frequently updated datasets.


Performance and Design Considerations

To optimize Direct Lake usage:

  • Use supported Delta table features and data types
  • Keep models simple and star-schema based
  • Avoid unnecessary bidirectional relationships
  • Monitor fallback behavior using performance tools
  • Test critical DAX measures for Direct Lake compatibility

From an exam standpoint, expect scenario-based questions asking you to choose Direct Lake and configure fallback appropriately for scale, freshness, and reliability.


When to Use Direct Lake

Direct Lake is best suited for:

  • Large datasets stored in OneLake
  • Near-real-time analytics
  • Enterprise models that need both performance and freshness
  • Organizations standardizing on Fabric Lakehouse or Warehouse architectures

Key DP-600 Takeaways

  • Direct Lake queries Delta tables directly in OneLake
  • Default fallback ensures query continuity when Direct Lake isn’t supported
  • Fallback behavior can be enabled or disabled
  • Data refresh is not required, but metadata refresh still matters
  • Understanding fallback and refresh behavior is critical for enterprise-scale optimization

DP-600 Exam Tip 💡

Expect scenario-based questions where you must decide:

  • Whether to enable or disable fallback
  • How refresh behaves after schema changes
  • Why a query is falling back unexpectedly

Practice Questions:

Here are 10 questions to test and help solidify your learning and knowledge. As you review these and other questions in your preparation, make sure to …

  • Identifying and understand why an option is correct (or incorrect) — not just which one
  • Look for and understand the usage scenario of keywords in exam questions to guide you
  • Expect scenario-based questions rather than direct definitions

1. What is the primary benefit of using Direct Lake mode in a Fabric semantic model?

A. It fully imports data into VertiPaq for maximum compression
B. It queries Delta tables in OneLake directly without data import
C. It sends all queries back to the source system
D. It eliminates the need for semantic models

Correct Answer: B

Explanation:
Direct Lake reads Delta/Parquet files directly from OneLake, avoiding both data import (Import mode) and source query execution (DirectQuery), enabling near-Import performance with fresher data.


2. When does a Direct Lake semantic model fall back to another query mode?

A. When scheduled refresh fails
B. When unsupported features or queries are encountered
C. When the dataset exceeds 1 GB
D. When row-level security is enabled

Correct Answer: B

Explanation:
Fallback occurs when a query or model feature is not supported by Direct Lake, such as certain DAX expressions or unsupported data types.


3. What is the default behavior of Direct Lake when a query cannot be executed in Direct Lake mode?

A. The query fails immediately
B. The query retries using Import mode only
C. The query automatically falls back to another supported mode
D. The semantic model is disabled

Correct Answer: C

Explanation:
By default, Direct Lake allows fallback to ensure query reliability. This allows reports to continue functioning even if Direct Lake cannot handle a specific request.


4. Why might an organization choose to disable fallback in a Direct Lake semantic model?

A. To reduce OneLake storage costs
B. To enforce consistent Direct Lake performance and detect incompatibilities
C. To allow automatic data imports
D. To improve data refresh frequency

Correct Answer: B

Explanation:
Disabling fallback ensures queries only run in Direct Lake mode. This is useful for performance validation and preventing unexpected query behavior.


5. Which action typically requires a metadata refresh in a Direct Lake semantic model?

A. Adding new rows to a Delta table
B. Updating existing fact table values
C. Adding a new column to a Delta table
D. Running a Power BI report

Correct Answer: C

Explanation:
Schema changes such as adding or removing columns require a metadata refresh so the semantic model can recognize structural changes.


6. How does Direct Lake handle new data written to Delta tables in OneLake?

A. Data is visible only after a scheduled refresh
B. Data is visible automatically without data refresh
C. Data is visible only after manual import
D. Data is cached permanently

Correct Answer: B

Explanation:
Direct Lake reads data directly from OneLake, so new or updated data becomes available without needing a traditional Import refresh.


7. Which scenario is MOST likely to cause Direct Lake fallback?

A. Simple SUM aggregation on a fact table
B. Querying a supported Delta table
C. Using unsupported DAX functions in a measure
D. Filtering data using slicers

Correct Answer: C

Explanation:
Certain complex or unsupported DAX functions can force fallback because Direct Lake cannot execute them efficiently using file-based access.


8. What happens if fallback is disabled and a query cannot be executed in Direct Lake mode?

A. The query automatically switches to DirectQuery
B. The query fails and returns an error
C. The semantic model imports the data
D. The model switches to Import mode permanently

Correct Answer: B

Explanation:
When fallback is disabled, unsupported queries fail instead of switching modes, making incompatibilities more visible during testing.


9. Which statement about refresh behavior in Direct Lake models is TRUE?

A. Full data refresh is always required
B. Direct Lake models do not support refresh
C. Only metadata refresh may be required
D. Refresh behaves the same as Import mode

Correct Answer: C

Explanation:
Direct Lake does not require full data refreshes because it reads data directly from OneLake. Metadata refresh is needed only for structural changes.


10. Why is Direct Lake well suited for enterprise-scale semantic models?

A. It eliminates the need for Delta tables
B. It supports unlimited bidirectional relationships
C. It combines near-Import performance with fresh data access
D. It forces all data into memory

Correct Answer: C

Explanation:
Direct Lake offers high performance without importing data, making it ideal for large datasets that require frequent updates and scalable analytics.

Deploy and Manage Semantic Models Using the XMLA Endpoint

This post is a part of the DP-600: Implementing Analytics Solutions Using Microsoft Fabric Exam Prep Hub; and this topic falls under these sections: 
Maintain a data analytics solution
--> Implement security and governance
--> Deploy and manage semantic models by using the XMLA endpoint

The XMLA endpoint enables advanced, enterprise-grade management of Power BI semantic models in Microsoft Fabric. It allows analytics engineers to deploy, modify, automate, and govern semantic models using external tools and scripts—bringing full ALM (Application Lifecycle Management) capabilities to analytics solutions.

For the DP-600 exam, you should understand what the XMLA endpoint is, when to use it, what it enables, and how it fits into the analytics development lifecycle.

What Is the XMLA Endpoint?

The XMLA (XML for Analysis) endpoint is a programmatic interface that exposes semantic models in Fabric as Analysis Services-compatible models.

Through the XMLA endpoint, you can:

  • Deploy semantic models
  • Modify model metadata
  • Manage partitions and refreshes
  • Automate changes across environments
  • Integrate with DevOps workflows

Exam note:
The XMLA endpoint is enabled by default in Fabric workspaces backed by appropriate capacity.

When to Use the XMLA Endpoint

The XMLA endpoint is used when you need:

  • Advanced model editing beyond Power BI Desktop
  • Automated deployments
  • Bulk changes across models
  • Integration with CI/CD pipelines
  • Scripted refresh and partition management

It is commonly used in enterprise and large-scale deployments.

Tools That Use the XMLA Endpoint

Several tools connect to Fabric semantic models through XMLA:

  • Tabular Editor
  • SQL Server Management Studio (SSMS)
  • PowerShell scripts
  • Azure DevOps pipelines
  • Custom automation tools

These tools operate directly on the semantic model metadata.

Common XMLA-Based Management Tasks

Deploying Semantic Models

  • Push model definitions from source control
  • Promote models across Dev, Test, and Prod
  • Align models with environment-specific settings

Managing Model Metadata

  • Create or modify:
    • Measures
    • Calculated columns
    • Relationships
    • Perspectives
  • Apply bulk changes efficiently

Managing Refresh and Partitions

  • Configure incremental refresh
  • Trigger or monitor refresh operations
  • Manage large models efficiently

XMLA Endpoint and the Development Lifecycle

XMLA plays a key role in:

  • CI/CD pipelines for analytics
  • Automated model validation
  • Environment promotion
  • Controlled production updates

It complements:

  • PBIP projects
  • Git integration
  • Development pipelines

Permissions and Requirements

To use the XMLA endpoint:

  • The workspace must be on supported capacity
  • The user must have sufficient permissions:
    • Workspace Admin or Member
  • Access is governed by Fabric and Entra ID

Exam insight:
Viewers cannot use XMLA to modify models.

XMLA Endpoint vs Power BI Desktop

FeaturePower BI DesktopXMLA Endpoint
Visual modelingYesNo
Scripted changesNoYes
AutomationLimitedStrong
Bulk editsNoYes
CI/CD integrationLimitedYes

Key takeaway:
Power BI Desktop is for design; XMLA is for enterprise management and automation.

Common Exam Scenarios

Expect questions such as:

  • Automating semantic model deployment → XMLA
  • Making bulk changes to measures → XMLA
  • Managing partitions for large models → XMLA
  • Integrating Power BI models into DevOps → XMLA
  • Editing a production model without Desktop → XMLA

Example:

A company needs to automate semantic model deployments across environments.
Correct concept: Use the XMLA endpoint.

Best Practices to Remember

  • Use XMLA for production changes and automation
  • Combine XMLA with:
    • Git repositories
    • Tabular Editor
    • Deployment pipelines
  • Limit XMLA access to trusted roles
  • Avoid manual production edits when automation is available

Key Exam Takeaways

  • XMLA enables advanced semantic model management
  • Supports automation, scripting, and CI/CD
  • Used with tools like Tabular Editor and SSMS
  • Requires appropriate permissions and capacity
  • A core ALM feature for DP-600

Exam Tips

  • If a question mentions automation, scripting, bulk model changes, or CI/CD, the answer is almost always the XMLA endpoint.
  • If it mentions visual report design, the answer is Power BI Desktop.
  • Expect questions that test:
    • When to use XMLA vs Power BI Desktop
    • Tool selection (Tabular Editor vs pipelines)
    • Security and permissions
    • Enterprise deployment scenarios
  • High-value keywords to remember:
    • XMLA • TMSL • External tools • CI/CD • Metadata management

Practice Questions

Question 1 (Single choice)

What is the PRIMARY purpose of the XMLA endpoint in Microsoft Fabric?

A. Enable SQL querying of lakehouses
B. Provide programmatic management of semantic models
C. Secure data using row-level security
D. Schedule data refreshes

Correct Answer: B

Explanation:
The XMLA endpoint enables advanced management and deployment of semantic models using tools such as:

  • Tabular Editor
  • SQL Server Management Studio (SSMS)
  • Power BI REST APIs

Question 2 (Multi-select)

Which tools can connect to a Fabric semantic model via the XMLA endpoint? (Select all that apply.)

A. Tabular Editor
B. SQL Server Management Studio (SSMS)
C. Power BI Desktop
D. Azure Data Studio

Correct Answers: A, B

Explanation:

  • Tabular Editor and SSMS use XMLA to manage models.
  • ❌ Power BI Desktop uses a local model, not XMLA.
  • ❌ Azure Data Studio does not manage semantic models via XMLA.

Question 3 (Scenario-based)

You want to deploy a semantic model from Development to Production while preserving model metadata. What is the BEST approach?

A. Export and re-import a PBIX file
B. Use deployment pipelines only
C. Use XMLA with model scripting
D. Rebuild the model manually

Correct Answer: C

Explanation:
XMLA enables:

  • Model scripting (TMSL)
  • Metadata-preserving deployments
  • Controlled promotion across environments

Question 4 (Single choice)

Which capability requires the XMLA endpoint to be enabled?

A. Creating reports
B. Editing DAX measures outside Power BI Desktop
C. Viewing model lineage
D. Applying sensitivity labels

Correct Answer: B

Explanation:
Editing measures, calculation groups, and partitions using external tools requires XMLA connectivity.


Question 5 (Scenario-based)

An enterprise team wants to automate semantic model deployment through CI/CD pipelines. Which XMLA-based artifact is MOST commonly used?

A. PBIP project file
B. TMSL scripts
C. DAX Studio queries
D. SQL views

Correct Answer: B

Explanation:
Tabular Model Scripting Language (TMSL) is the standard XMLA-based format for:

  • Creating
  • Updating
  • Deploying semantic models programmatically

Question 6 (Multi-select)

Which operations can be performed through the XMLA endpoint? (Select all that apply.)

A. Create and modify measures
B. Configure partitions and refresh policies
C. Apply row-level security
D. Build report visuals

Correct Answers: A, B, C

Explanation:
XMLA supports model-level operations. Report visuals are created in Power BI reports, not via XMLA.


Question 7 (Scenario-based)

You attempt to connect to a semantic model via XMLA but the connection fails. What is the MOST likely cause?

A. XMLA endpoint is disabled for the workspace
B. Dataset refresh is in progress
C. Data source credentials are missing
D. The report is unpublished

Correct Answer: A

Explanation:
XMLA must be:

  • Enabled at the capacity or workspace level
  • Supported by the Fabric SKU

Question 8 (Single choice)

Which security requirement applies when using the XMLA endpoint?

A. Viewer permissions are sufficient
B. Read permission only
C. Contributor or higher workspace role
D. Report Builder permissions

Correct Answer: C

Explanation:
Managing semantic models via XMLA requires Contributor, Member, or Admin roles.


Question 9 (Scenario-based)

A developer edits calculation groups using Tabular Editor via XMLA. What happens after saving changes?

A. Changes remain local only
B. Changes are immediately published to the semantic model
C. Changes require a dataset refresh to apply
D. Changes are stored in the PBIX file

Correct Answer: B

Explanation:
Edits made via XMLA tools apply directly to the deployed semantic model in Fabric.


Question 10 (Multi-select)

Which are BEST practices when managing semantic models using XMLA? (Select all that apply.)

A. Use source control for TMSL scripts
B. Limit XMLA access to production workspaces
C. Make direct changes in production without testing
D. Combine XMLA with deployment pipelines

Correct Answers: A, B, D

Explanation:
Best practices include:

  • Version control
  • Controlled access
  • Structured deployments

❌ Direct production changes without testing increase risk.


Create and Update Reusable Assets, including Power BI template (.pbit) files, Power BI data source (.pbids) files, and shared semantic models in Microsoft Fabric

This post is a part of the DP-600: Implementing Analytics Solutions Using Microsoft Fabric Exam Prep Hub; and this topic falls under these sections: 
Maintain a data analytics solution
--> Maintain the analytics development lifecycle
--> Create and update reusable assets, including Power BI template (.pbit)
files, Power BI data source (.pbids) files, and shared semantic models

Reusable assets are a key lifecycle concept in Microsoft Fabric and Power BI. They enable consistency, scalability, and efficiency by allowing teams to standardize how data is connected, modeled, and visualized across multiple solutions.

For the DP-600 exam, you should understand what reusable assets are, how to create and manage them, and when each type is appropriate.

What Are Reusable Assets?

Reusable assets are analytics artifacts designed to be:

  • Used by multiple users or teams
  • Reapplied across projects
  • Centrally governed and maintained

Common reusable assets include:

  • Power BI template (.pbit) files
  • Power BI data source (.pbids) files
  • Shared semantic models

Power BI Template Files (.pbit)

What Is a PBIT File?

A .pbit file is a Power BI template that contains:

  • Report layout and visuals
  • Data model structure (tables, relationships, measures)
  • Parameters and queries (without data)

It does not include actual data.

When to Use PBIT Files

PBIT files are ideal when:

  • Standardizing report design and metrics
  • Distributing reusable report frameworks
  • Supporting self-service analytics at scale
  • Onboarding new analysts

Creating and Updating PBIT Files

  • Create a report in Power BI Desktop
  • Remove data (if present)
  • Save as Power BI Template (.pbit)
  • Store in source control or shared repository
  • Update centrally and redistribute as needed

Power BI Data Source Files (.pbids)

What Is a PBIDS File?

A .pbids file is a JSON-based file that defines:

  • Data source connection details
  • Server, database, or endpoint information
  • Authentication type (but not credentials)

Opening a PBIDS file launches Power BI Desktop and guides users through connecting to the correct data source.

When to Use PBIDS Files

PBIDS files are useful for:

  • Standardizing data connections
  • Reducing configuration errors
  • Guiding business users to approved sources
  • Supporting governed self-service analytics

Managing PBIDS Files

  • Create manually or export from Power BI Desktop
  • Store centrally (e.g., Git, SharePoint)
  • Update when connection details change
  • Pair with shared semantic models where possible

Shared Semantic Models

What Are Shared Semantic Models?

Shared semantic models are centrally managed datasets that:

  • Define business logic, measures, and relationships
  • Serve as a single source of truth
  • Are reused across multiple reports

They are one of the most important reusable assets in Fabric.

Benefits of Shared Semantic Models

  • Consistent metrics across reports
  • Reduced duplication
  • Centralized governance
  • Better performance and manageability

Managing Shared Semantic Models

Shared semantic models are:

  • Developed by analytics engineers
  • Published to Fabric workspaces
  • Shared using Build permission
  • Governed with:
    • RLS and OLS
    • Sensitivity labels
    • Endorsements (Promoted/Certified)

How These Assets Work Together

A common pattern:

  • PBIDS → Standardizes connection
  • Shared semantic model → Defines logic
  • PBIT → Standardizes report layout

This layered approach is frequently tested in exam scenarios.

Reusable Assets and the Development Lifecycle

Reusable assets support:

  • Faster development
  • Consistent deployments
  • Easier maintenance
  • Scalable self-service analytics

They align naturally with:

  • PBIP projects
  • Git version control
  • Development pipelines
  • XMLA-based automation

Common Exam Scenarios

You may be asked:

  • How to distribute a standardized report template → PBIT
  • How to ensure users connect to the correct data source → PBIDS
  • How to enforce consistent business logic → Shared semantic model
  • How to reduce duplicate datasets → Shared model + Build permission

Example:

Multiple teams need to create reports using the same metrics and layout.
Correct concepts: Shared semantic model and PBIT.

Best Practices to Remember

  • Centralize ownership of shared semantic models
  • Certify trusted reusable assets
  • Store templates and PBIDS files in source control
  • Avoid duplicating business logic in individual reports
  • Pair reusable assets with governance features

Key Exam Takeaways

  • Reusable assets improve consistency and scalability
  • PBIT files standardize report design
  • PBIDS files standardize data connections
  • Shared semantic models centralize business logic
  • All are core lifecycle tools in Fabric

Exam Tips

  • If a question focuses on standardization, reuse, or self-service at scale, think PBIT, PBIDS, and shared semantic models—and choose the one that matches the problem being solved.
  • Expect scenarios that test:
    • When to use PBIT vs PBIDS vs shared semantic models
    • Governance and consistency
    • Enterprise BI scalability
  • Quick memory aid:
    • PBIT = Layout + Model (no data)
    • PBIDS = Connection only
    • Shared model = Logic once, reports many

Practice Questions

Question 1 (Single choice)

What is the PRIMARY purpose of a Power BI template (.pbit) file?

A. Store report data for reuse
B. Share report layout and model structure without data
C. Store credentials securely
D. Enable real-time data refresh

Correct Answer: B

Explanation:
A .pbit file contains:

  • Report layout
  • Semantic model (tables, relationships, measures)
  • No data

It’s used to standardize report creation.


Question 2 (Multi-select)

Which components are included in a Power BI template (.pbit)? (Select all that apply.)

A. Report visuals
B. Data model schema
C. Data source credentials
D. DAX measures

Correct Answers: A, B, D

Explanation:

  • Templates include visuals, schema, relationships, and measures.
  • ❌ Credentials and data are never included.

Question 3 (Scenario-based)

Your organization wants users to quickly connect to approved data sources while preventing incorrect connection strings. Which reusable asset is BEST?

A. PBIX file
B. PBIT file
C. PBIDS file
D. Shared semantic model

Correct Answer: C

Explanation:
PBIDS files:

  • Predefine connection details
  • Guide users to approved data sources
  • Improve governance and consistency

Question 4 (Single choice)

Which statement about Power BI data source (.pbids) files is TRUE?

A. They contain report visuals
B. They contain DAX measures
C. They define connection metadata only
D. They store dataset refresh schedules

Correct Answer: C

Explanation:
PBIDS files only store:

  • Data source type
  • Server/database info
    They do NOT include visuals, data, or logic.

Question 5 (Scenario-based)

You want multiple reports to use the same curated dataset to ensure consistent KPIs. What should you implement?

A. Multiple PBIX files
B. Power BI templates
C. Shared semantic model
D. PBIDS files

Correct Answer: C

Explanation:
A shared semantic model allows:

  • Centralized logic
  • Single source of truth
  • Multiple reports connected via Live/Direct Lake

Question 6 (Multi-select)

Which benefits are provided by shared semantic models? (Select all that apply.)

A. Consistent calculations across reports
B. Reduced duplication of datasets
C. Independent refresh schedules per report
D. Centralized security management

Correct Answers: A, B, D

Explanation:

  • Shared models enforce consistency and reduce maintenance.
  • ❌ Refresh is managed at the model level, not per report.

Question 7 (Scenario-based)

You update a shared semantic model’s calculation logic. What is the impact?

A. Only new reports see the change
B. All connected reports reflect the change
C. Reports must be republished
D. Only the workspace owner sees updates

Correct Answer: B

Explanation:
All reports connected to a shared semantic model automatically reflect changes.


Question 8 (Single choice)

Which reusable asset BEST supports report creation without requiring Power BI Desktop modeling skills?

A. PBIX file
B. PBIT file
C. PBIDS file
D. Shared semantic model

Correct Answer: D

Explanation:
Users can build reports directly on shared semantic models using existing fields and measures.


Question 9 (Scenario-based)

You want to standardize report branding, page layout, and slicers across teams. What should you distribute?

A. PBIDS file
B. Shared semantic model
C. PBIT file
D. XMLA script

Correct Answer: C

Explanation:
PBIT files are ideal for:

  • Visual consistency
  • Reusable layouts
  • Standard filters and slicers

Question 10 (Multi-select)

Which are BEST practices when managing reusable Power BI assets? (Select all that apply.)

A. Store PBIT and PBIDS files in version control
B. Update shared semantic models directly in production without testing
C. Document reusable asset usage
D. Combine shared semantic models with deployment pipelines

Correct Answers: A, C, D

Explanation:
Best practices emphasize:

  • Governance
  • Controlled updates
  • Documentation

❌ Direct production edits increase risk.


Choosing the Right Chart to display your data in Power BI or any other analytics tool

Data visualization is at the heart of analytics. Choosing the right chart or visual can make the difference between insights that are clear and actionable, and insights that remain hidden. There are many visualization types available for showcasing your data, and choosing the right ones for your use cases is important. Below, we’ll walk through some common scenarios and share information on the charts best suited for them, and will also touch on some Power BI–specific visuals you should know about.

1. Showing Trends Over Time

When to use: To track how a measure changes over days, months, or years.

Best charts:

  • Line Chart: The classic choice for time series data. Best when you want to show continuous change. In Power BI, the line chart visual can also be used for forecasting trends.
  • Area Chart: Like a line chart but emphasizes volume under the curve—great for cumulative values or when you want to highlight magnitude.
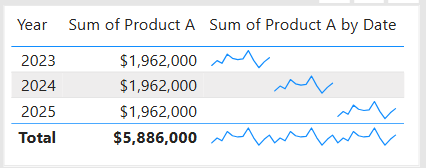
  • Sparklines (Power BI): Miniature line charts embedded in tables or matrices. Ideal for giving quick context without taking up space.

2. Comparing Categories

When to use: To compare values across distinct groups (e.g., sales by region, revenue by product).

Best charts:

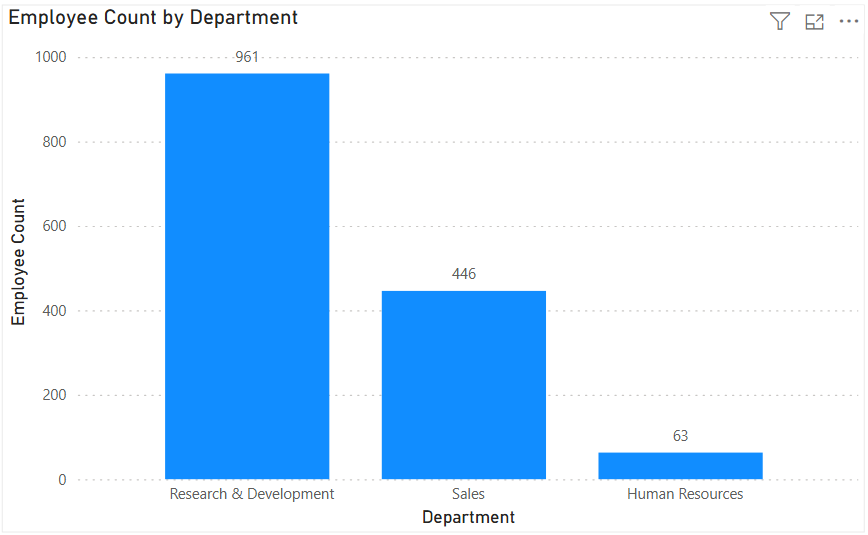
  • Column Chart: Vertical bars for category comparisons. Good when categories are on the horizontal axis.
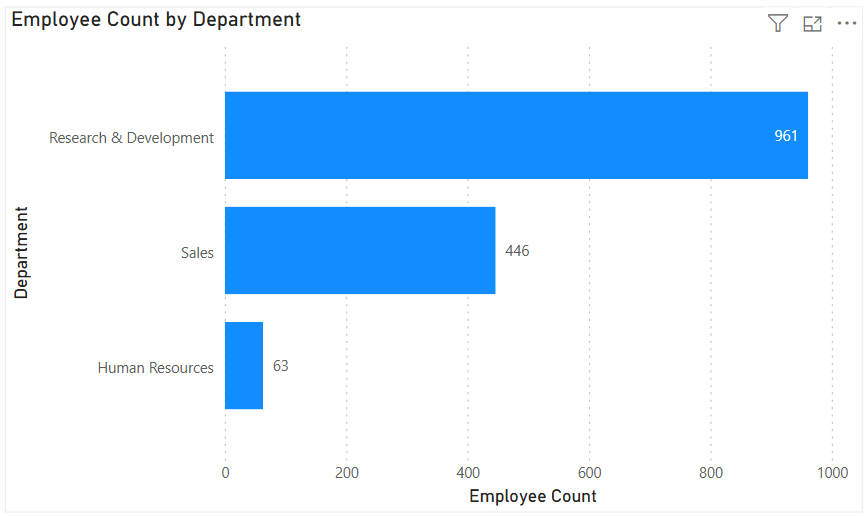
  • Bar Chart: Horizontal bars—useful when category names are long or when ranking items. Is usually a better choice than the column chart when there are many values.
  • Stacked Column/Bar Chart: Show category totals and subcategories in one view. Works for proportional breakdowns, but can get hard to compare across categories.

3. Understanding Relationships

When to use: To see whether two measures are related (e.g., advertising spend vs. sales revenue).

Best charts:

  • Scatter Chart: Plots data points across two axes. Useful for correlation analysis. Add a third variable with bubble size or color to generate more insights. This chart can also be useful for identifying anomalies/outliers in the data.
  • Line & Scatter Combination: Power BI lets you overlay a line for trend direction while keeping the scatter points.
  • Line & Bar/Column Chart Combination: Power BI offers some of these combination charts also to allow you to relate your comparison measures to your trend measures.

4. Highlighting Key Metrics

Sometimes you don’t need a chart—you just want a single number to stand out. These types of visuals are great for high-level executive dashboards, or for the summary page of dashboards in general.

Best visuals in Power BI:

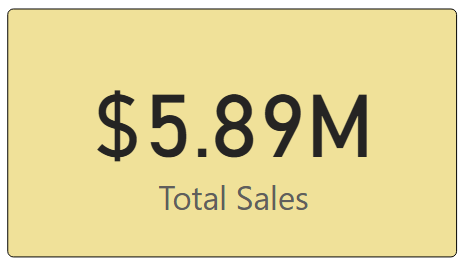
  • Card Visual: Displays one value clearly, like Total Sales.
  • KPI Visual: Adds target context and status indicator (e.g., actual vs. goal).
  • Gauge Visual: Circular representation of progress toward a goal—best for showing percentages or progress to target. For example, Performance Rating score shown on the scale of the goal.

5. Distribution Analysis

When to use: To see how data is spread across categories or ranges.

Best charts:

  • Column/Bar Chart with bins: Useful for creating histograms in Power BI.
  • Box-and-Whisker Chart (custom visual): Shows median, quartiles, and outliers.
  • Pie/Donut Charts: While often overused, they can be effective for showing composition when categories are few (ideally 3–5). For example, show the number and percentage of employees in each department.

6. Spotting Problem Areas

When to use: To identify anomalies or areas needing attention across a large dataset.

Best charts:

  • Heatmap: A table where color intensity represents value magnitude. Excellent for finding hot spots or gaps. This can be implemented in Power BI by using a Matrix visual with conditional formatting in Power BI.
  • Treemap: Breaks data into rectangles sized by value—helpful for hierarchical comparisons and for easily identifying the major components of the whole.

7. Detail-Level Exploration

When to use: To dive into raw data while keeping formatting and hierarchy.

Best visuals:

  • Table: Shows granular row-level data. Best for detail reporting.
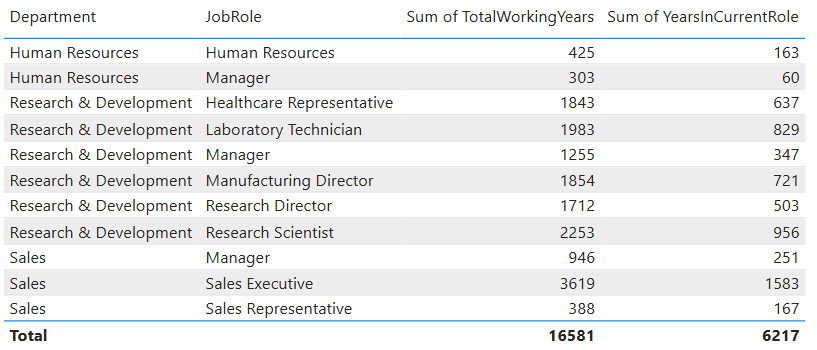
  • Matrix: Adds pivot-table–like functionality with rows, columns, and drill-down. Often combined with conditional formatting and sparklines for added insight.

8. Part-to-Whole Analysis

When to use: To see how individual parts contribute to a total.

Best charts:

  • Stacked Charts: Show both totals and category breakdowns.
  • 100% Stacked Charts: Normalize totals so comparisons are by percentage share.
  • Treemap: Visualizes hierarchical data contributions in space-efficient blocks.

Quick Reference: Which Chart to Use?

ScenarioBest Visuals
Tracking trends, forecasting trendsLine, Area, Sparklines
Comparing categoriesColumn, Bar, Stacked
Showing relationshipsScatter, Line + Scatter, Line + Column/Bar
Highlighting metricsCard, KPI, Gauge
Analyzing distributionsHistogram (columns with bins), Box & Whisker, Pie/Donut (for few categories)
Identifying problem areasHeatmap (Matrix with colors), Treemap, Scatter
Exploring detail dataTable, Matrix
Showing part-to-wholeStacked Column/Bar, 100% Stacked, Treemap, Pie/Donut

The below graphic shows the visualization types available in Power BI. You can also import additional visuals by clicking the “3-dots” (get more visuals) at the bottom of the visualization icons.

Summary

Power BI, and other BI/analytics tools, offers a rich set of visuals, each designed to represent data in a way that suits a specific set of analytical needs. The key is to match the chart type with the story you want the data to tell. Whether you’re showing a simple KPI, uncovering trends, or surfacing problem areas, choosing the right chart ensures your insights are clear, actionable, and impactful. In addition, based on your scenario, it can also be beneficial to get feedback from the user population on what other visuals they might find useful or what other ways they would they like to see the data.

Thanks for reading! And good luck on your data journey!