Division is a common operation in Power BI, but it can cause errors when the divisor is zero. Both DAX and Power Query provide built-in ways to handle these scenarios safely.
Safe DIVIDE in DAX
In DAX, the DIVIDE function is the recommended approach. Its syntax is:
DIVIDE(numerator, divisor [, alternateResult])
If the divisor is zero (or BLANK), the function returns the optional alternateResult; otherwise, it performs the division normally.
Examples:
DIVIDE(10, 2) → 5
DIVIDE(10, 0) → BLANK
DIVIDE(10, 0, 0) → 0
This makes DIVIDE safer and cleaner than using conditional logic.
Safe DIVIDE in Power Query
In Power Query (M language), you can use the try … otherwise expression to handle divide-by-zero errors gracefully. The syntax is:
try [expression] otherwise [alternateValue]
Example:
try [Sales] / [Quantity] otherwise 0
If the division fails (such as when Quantity is zero), Power Query returns 0 instead of an error.
Using DIVIDE in DAX and try … otherwise in Power Query ensures your division calculations remain error-free.
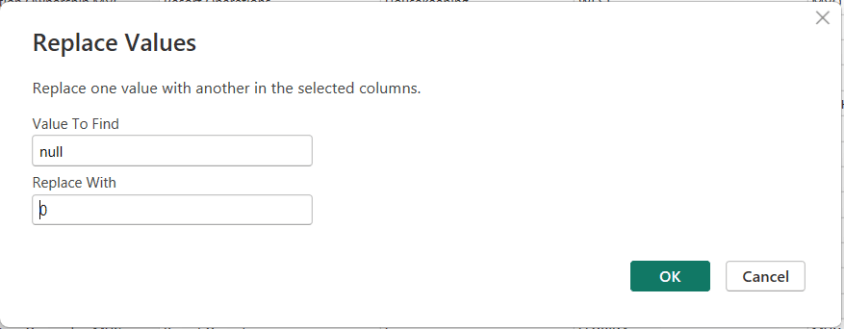
In Power BI, handling NULL values is a common data-preparation step to get your data ready for analysis, and Power Query makes this easy using the Replace Values feature.
This option is available from both the Home menu …
… and the Transform menu in the Power Query Editor.
To replace NULLs, first select the column where the NULL values exist. Then choose Replace Values. When the dialog box appears, enter null as the value to find and replace, and specify the value you want to use instead—such as 0 for numeric columns or “Unknown” for text columns.
After confirming, Power Query automatically updates the column and records the step.
In Microsoft Fabric, the Visual Query Editor (VQE) provides a low-code, graphical experience for querying data across lakehouses, warehouses, and semantic models. It allows analytics engineers to explore, shape, and summarize data without writing SQL or KQL, while still generating optimized queries behind the scenes.
For the DP-600 exam, you should understand what the Visual Query Editor is, where it’s used, and how to perform common data analysis tasks such as selecting columns, filtering rows, and aggregating data.
What Is the Visual Query Editor?
The Visual Query Editor is a graphical query-building interface available in multiple Fabric experiences, including:
Lakehouse SQL analytics endpoint
Warehouse
Power BI (Direct Lake and DirectQuery scenarios)
Data exploration within Fabric items
Instead of writing queries manually, you interact with:
Tables and columns
Drag-and-drop operations
Menus for filters, grouping, and aggregations
Fabric then translates these actions into optimized SQL or engine-specific queries.
Selecting Data
Selecting data in the Visual Query Editor focuses on choosing the right columns and datasets for analysis.
Key Capabilities
Select or deselect columns from one or more tables
Rename columns for readability
Reorder columns for analysis or reporting
Combine columns from related tables (via existing relationships)
Exam Tips
Selecting fewer columns improves performance and reduces data transfer.
Column renaming in VQE affects the query result, not the underlying table schema.
The Visual Query Editor respects relationships defined in semantic models and warehouses.
Filtering Data
Filtering allows you to limit rows based on conditions, ensuring only relevant data is included.
Common Filter Types
Equality filters (e.g., Status = "Active")
Range filters (e.g., dates, numeric thresholds)
Text filters (contains, starts with, ends with)
Null / non-null filters
Relative date filters (last 7 days, current month)
Where Filtering Is Applied
At the query level, not permanently in the data source
Before aggregation (important for correct results)
Exam Tips
Filters applied in the Visual Query Editor are executed at the data source when possible (query folding).
Filtering early improves performance and reduces memory usage.
Be aware of how filters interact with aggregations.
Aggregating Data
Aggregation summarizes data by grouping rows and applying calculations.
Common Aggregations
Sum
Count / Count Distinct
Average
Min / Max
Grouping Data
Select one or more columns as group-by fields
Apply aggregations to numeric or date columns
Results return one row per group
Examples
Total sales by product category
Count of orders per customer
Average response time by day
Exam Tips
Aggregations in the Visual Query Editor are conceptually similar to GROUP BY in SQL.
Aggregated queries reduce dataset size and improve performance.
Understand the difference between row-level data and aggregated results.
Behind the Scenes: Generated Queries
Although the Visual Query Editor is low-code, Fabric generates:
SQL queries for warehouses and lakehouse SQL endpoints
Optimized engine-specific queries for semantic models
This ensures:
Efficient execution
Compatibility with Direct Lake and DirectQuery
Consistent results across Fabric experiences
Exam Tip
You are not required to read or write the generated SQL, but you should understand that the Visual Query Editor does not bypass query optimization.
When to Use the Visual Query Editor
Use the Visual Query Editor when:
Quickly exploring unfamiliar datasets
Building queries without writing code
Creating reusable query logic for reports
Teaching or collaborating with less SQL-focused users
Avoid it when:
Complex transformations are required (use SQL, Spark, or Dataflows)
Highly customized logic is needed beyond supported operations
Key Exam Takeaways
For the DP-600 exam, remember:
The Visual Query Editor is a graphical query-building tool in Microsoft Fabric.
It supports selecting columns, filtering rows, and aggregating data.
Operations are translated into optimized queries executed at the data source.
Filtering occurs before aggregation, affecting results and performance.
It is commonly used with lakehouses, warehouses, and semantic models.
Practice Questions:
Here are 10 questions to test and help solidify your learning and knowledge. As you review these and other questions in your preparation, make sure to …
Identifying and understand why an option is correct (or incorrect) — not just which one
Look for and understand the usage scenario of keywords in exam questions to guide you
Expect scenario-based questions rather than direct definitions
Know the purpose and scope of the Visual Query Editor
Know how to selecting, filtering, and aggregating data
Understand execution order and performance implications
Know when to use (and not use) the Visual Query Editor
Question 1
What is the primary purpose of the Visual Query Editor in Microsoft Fabric?
A. To permanently modify table schemas B. To build queries visually without writing SQL C. To replace semantic models D. To manage workspace permissions
Correct Answer:B
Explanation: The Visual Query Editor provides a low-code, graphical interface for building queries. It does not modify schemas, replace models, or manage security.
Question 2
When you deselect a column in the Visual Query Editor, what happens?
A. The column is deleted from the source table B. The column is hidden permanently for all users C. The column is excluded only from the query results D. The column data type is changed
Correct Answer:C
Explanation: Column selection affects only the query output, not the underlying data or schema.
Question 3
Why is it considered a best practice to select only required columns in a query?
A. It enforces data security B. It reduces query complexity and improves performance C. It enables Direct Lake mode D. It prevents duplicate rows
Correct Answer:B
Explanation: Selecting fewer columns reduces data movement and memory usage, leading to better performance.
Question 4
Which type of filter is commonly used to restrict data to a recent time period?
A. Equality filter B. Text filter C. Relative date filter D. Aggregate filter
Correct Answer:C
Explanation: Relative date filters (e.g., “Last 30 days”) dynamically adjust based on the current date and are commonly used in analytics.
Question 5
At what stage of query execution are filters applied in the Visual Query Editor?
A. After aggregation B. After the query result is returned C. Before aggregation D. Only in the Power BI report layer
Correct Answer:C
Explanation: Filters are applied before aggregation, ensuring accurate summary results and better performance.
Question 6
Which aggregation requires grouping to produce meaningful results?
A. SUM B. COUNT C. GROUP BY D. MIN
Correct Answer:C
Explanation: Grouping defines how rows are summarized. Aggregations like SUM or COUNT rely on GROUP BY logic to produce per-group results.
Question 7
You want to see total sales by product category. Which Visual Query Editor actions are required?
A. Filter Product Category and sort by Sales B. Group by Product Category and apply SUM to Sales C. Count Product Category and filter Sales D. Rename Product Category and aggregate rows
Correct Answer:B
Explanation: This scenario requires grouping on Product Category and applying a SUM aggregation to the Sales column.
Question 8
What happens behind the scenes when you build a query using the Visual Query Editor?
A. Fabric stores a cached dataset only B. Fabric generates optimized SQL or engine-specific queries C. Fabric converts the query into DAX D. Fabric disables query folding
Correct Answer:B
Explanation: The Visual Query Editor translates visual actions into optimized queries (such as SQL) that execute at the data source.
Question 9
Which Fabric items commonly support querying through the Visual Query Editor?
A. Pipelines and notebooks only B. Dashboards only C. Lakehouses, warehouses, and semantic models D. Eventhouses only
Correct Answer:C
Explanation: The Visual Query Editor is widely used across lakehouses, warehouses, and semantic models in Fabric.
Question 10
When should you avoid using the Visual Query Editor?
A. When exploring new datasets B. When building quick aggregations C. When complex transformation logic is required D. When filtering data
Correct Answer:C
Explanation: For advanced or complex transformations, SQL, Spark, or Dataflows are more appropriate than the Visual Query Editor.
Filtering data is one of the most fundamental transformation operations used when preparing analytics data. It ensures that only relevant, valid, and accurate records are included in curated tables or models. Filtering improves performance, reduces unnecessary processing overhead, and helps enforce business logic early in the analytics pipeline.
In Microsoft Fabric, filtering occurs at multiple transformation layers — from ingestion tools to interactive modeling. For the DP-600 exam, you should understand where, why, and how to filter data effectively using various tools and technologies within Fabric.
Why Filter Data?
Filtering data serves several key purposes in analytics:
1. Improve Query and Report Performance
Reduces the amount of data scanned and processed
Enables faster refresh and retrieval
2. Enforce Business Logic
Excludes irrelevant segments (e.g., test data, canceled transactions)
Supports clean analytical results
3. Prepare Analytics-Ready Data
Limits datasets to required time periods or categories
Produces smaller, focused outputs for reporting
4. Reduce Cost
Smaller processing needs reduce compute and storage overhead
Where Filtering Happens in Microsoft Fabric
Filtering can be implemented at multiple stages:
Layer
How You Filter
Power Query (Dataflows Gen2 / Lakehouse)
UI filters or M code
SQL (Warehouse & Lakehouse SQL analytics)
WHERE clauses
Spark (Lakehouse Notebooks)
DataFrame filter() / where()
Pipelines (Data Movement)
Source filters or query-based extraction
Semantic Models (Power BI / DAX)
Query filters, slicers, and row-level security
Filtering early, as close to the data source as possible, ensures better performance downstream.
Tools and Techniques
1. Power Query (Low-Code)
Power Query provides a user-friendly interface to filter rows:
Text filters: Equals, Begins With, Contains, etc.
Number filters: Greater than, Between, Top N, etc.
Date filters: Before, After, This Month, Last 12 Months, etc.
Remove blank or null values
These filters are recorded as transformation steps and can be reused or versioned.
2. SQL (Warehouses & Lakehouses)
SQL filtering uses the WHERE clause:
SELECT *
FROM Sales
WHERE OrderDate >= '2025-01-01'
  AND Country = 'USA';
SQL filtering is efficient and pushed down to the engine, reducing row counts early.
3. Spark (Notebooks)
Filtering in Spark (PySpark example):
filtered_df = df.filter(df["SalesAmount"] > 1000)
Or with SQL in Spark:
SELECT *
FROM sales
WHERE SalesAmount > 1000;
Spark filtering is optimized for distributed processing across big datasets.
4. Pipelines (Data Movement)
During ingestion or ETL, you can apply filters in:
Copy activity query filters
Source queries
Pre-processing steps
This ensures only needed rows land in the target store.
5. Semantic Model Filters
In Power BI and semantic models, filtering can happen as:
These filters control what users see rather than what data is stored.
Business and Data Quality Scenarios
Filtering is often tied to business needs such as:
Excluding invalid, test, or archived records
Restricting to active customers only
Selecting a specific date range (e.g., last fiscal year)
Filtering data for regional or product segments
Filtering vs Security
It’s important to distinguish filtering for transformation from security filters:
Filtering
Security
Removes unwanted rows during transformation
Controls what users are allowed to see
Improves performance
Enforces access control
Happens before modeling
Happens during query evaluation
Best Practices
When filtering data in Microsoft Fabric:
Filter early in the pipeline to reduce volume
Use pushdown filters in SQL when querying large sources
Document filtering logic for audit and governance
Combine filters logically (AND/OR) to match business rules
Avoid filtering in the semantic model when it can be done upstream
Common Exam Scenarios
You may be asked to:
Choose the correct tool and stage for filtering
Translate business rules into filter logic
Recognize when filtering improves performance
Identify risks of filtering too late or in the wrong layer
Example exam prompt: “A dataset should exclude test transactions and include only the last 12 months of sales. Which transformation step should be applied and where?” The correct answer will involve filtering early with SQL or Power Query before modeling.
Key Takeaways
Filtering data is a core part of preparing analytics-ready datasets.
Multiple Fabric components support filtering (Power Query, SQL, Spark, pipelines).
Filtering early improves performance and reduces unnecessary workload.
Understand filtering in context — transformation vs. security.
Final Exam Tips
When a question asks about reducing dataset size, improving performance, or enforcing business logic before loading into a model, filtering is often the correct action — and it usually belongs upstream.
Filter early and upstream whenever possible
Use SQL or Power Query for transformation-level filtering
Avoid relying solely on report-level filters for large datasets
Distinguish filtering for performance from security filtering
Practice Questions:
Here are 10 questions to test and help solidify your learning and knowledge. As you review these and other questions in your preparation, make sure to …
Identifying and understand why an option is correct (or incorrect) — not just which one
Look for and understand the usage scenario of keywords in exam questions to guide you
Expect scenario-based questions rather than direct definitions
Question 1
What is the primary purpose of filtering data during the transformation phase?
A. To enforce user-level security B. To reduce data volume and improve performance C. To encrypt sensitive columns D. To normalize data structures
Correct Answer:B
Explanation: Filtering removes unnecessary rows early in the pipeline, reducing data volume, improving performance, and lowering compute costs. Security and normalization are separate concerns.
Question 2
Which Fabric component allows low-code, UI-driven row filtering during data preparation?
A. Spark notebooks B. SQL warehouse C. Power Query (Dataflows Gen2) D. Semantic models
Correct Answer:C
Explanation: Power Query provides a graphical interface for filtering rows using text, numeric, and date-based filters, making it ideal for low-code transformations.
Question 3
Which SQL clause is used to filter rows in a lakehouse or warehouse?
A. GROUP BY B. HAVING C. WHERE D. ORDER BY
Correct Answer:C
Explanation: The WHERE clause filters rows before aggregation or sorting, making it the primary SQL mechanism for data filtering.
Question 4
Which filtering approach is most efficient for very large datasets?
A. Filtering in Power BI visuals B. Filtering after loading data into a semantic model C. Filtering at the source using SQL or ingestion queries D. Filtering using calculated columns
Correct Answer:C
Explanation: Filtering as close to the source as possible minimizes data movement and processing, making it the most efficient approach for large datasets.
Question 5
In a Spark notebook, which method is commonly used to filter a DataFrame?
A. select() B. filter() or where() C. join() D. distinct()
Correct Answer:B
Explanation: Spark DataFrames use filter() or where() to remove rows based on conditions.
Question 6
Which scenario is an example of business-rule filtering?
A. Removing duplicate rows B. Converting text to numeric data types C. Excluding canceled orders from sales analysis D. Creating a star schema
Correct Answer:C
Explanation: Business-rule filtering enforces organizational logic, such as excluding canceled or test transactions from analytics.
Question 7
What is the key difference between data filtering and row-level security (RLS)?
A. Filtering improves query speed; RLS does not B. Filtering removes data; RLS restricts visibility C. Filtering is applied only in SQL; RLS is applied only in Power BI D. Filtering is mandatory; RLS is optional
Correct Answer:B
Explanation: Filtering removes rows from the dataset, while RLS controls which rows users can see without removing the data itself.
Question 8
Which filtering method is typically applied after data has already been loaded?
A. Source query filters B. Pipeline copy activity filters C. Semantic model report filters D. Power Query transformations
Correct Answer:C
Explanation: Report and visual filters in semantic models are applied at query time and do not reduce stored data volume.
Question 9
Why is filtering data early in the pipeline considered a best practice?
A. It increases data redundancy B. It simplifies semantic model design C. It reduces processing and storage costs D. It improves data encryption
Correct Answer:C
Explanation: Early filtering minimizes unnecessary data processing and storage, improving efficiency across the entire analytics solution.
Question 10
A dataset should include only the last 12 months of data. Where should this filter ideally be applied?
A. In Power BI slicers B. In the semantic model C. During data ingestion or transformation D. In calculated measures
Correct Answer:C
Explanation: Applying time-based filters during ingestion or transformation ensures only relevant data is processed and stored, improving performance and consistency.
One of the most important architectural decisions a Microsoft Fabric Analytics Engineer must make is selecting the right analytical store for a given workload. For the DP-600 exam, this topic tests your ability to choose between a Lakehouse, Warehouse, or Eventhouse based on data type, query patterns, latency requirements, and user personas.
Overview of the Three Options
Microsoft Fabric provides three primary analytics storage and query experiences:
Option
Primary Purpose
Lakehouse
Flexible analytics on files and tables using Spark and SQL
Warehouse
Enterprise-grade SQL analytics and BI reporting
Eventhouse
Real-time and near-real-time analytics on streaming data
Understanding why and when to use each is critical for DP-600 success.
Lakehouse
What Is a Lakehouse?
A Lakehouse combines the flexibility of a data lake with the structure of a data warehouse. Data is stored in Delta Lake format in OneLake and can be accessed using both Spark and SQL.
When to Choose a Lakehouse
Choose a Lakehouse when you need:
Flexible schema (schema-on-read or schema-on-write)
Exam signal words:flexible, raw data, Spark, data science, experimentation
Warehouse
What Is a Warehouse?
A Warehouse is a fully managed, SQL-first analytical store optimized for business intelligence and reporting. It enforces schema-on-write and provides a traditional relational experience.
When to Choose a Warehouse
Choose a Warehouse when you need:
Strong SQL-based analytics
High-performance reporting
Well-defined schemas and governance
Centralized enterprise BI
Compatibility with Power BI Import or DirectQuery
Key Characteristics
T-SQL only (no Spark)
Optimized for structured data
Best for star/snowflake schemas
Familiar experience for SQL developers
Exam signal words:enterprise BI, reporting, structured, governed, SQL-first
Eventhouse
What Is an Eventhouse?
An Eventhouse is optimized for real-time and streaming analytics, built on KQL (Kusto Query Language). It is designed to handle high-velocity event data.
When to Choose an Eventhouse
Choose an Eventhouse when you need:
Near-real-time or real-time analytics
Streaming data ingestion
Operational or telemetry analytics
Event-based dashboards and alerts
Key Characteristics
Uses KQL for querying
Integrates with Eventstreams
Handles massive ingestion rates
Optimized for time-series data
Exam signal words:streaming, telemetry, IoT, real-time, events
Choosing the Right Option (Exam-Critical)
The DP-600 exam often presents scenarios where multiple options could work, but only one best fits the requirements.
Decision Matrix
Requirement
Best Choice
Raw + curated data
Lakehouse
Complex Spark transformations
Lakehouse
Enterprise BI reporting
Warehouse
Strong governance and schemas
Warehouse
Streaming or telemetry data
Eventhouse
Near-real-time dashboards
Eventhouse
SQL-only users
Warehouse
Data science workloads
Lakehouse
Common Exam Scenarios
You may be asked to:
Choose a storage type for a new analytics solution
Migrate from traditional systems to Fabric
Support both engineers and analysts
Enable real-time monitoring
Balance governance with flexibility
Always identify:
Data type (batch vs streaming)
Latency requirements
User personas
Query language
Governance needs
Best Practices to Remember
Use Lakehouse as a flexible foundation for analytics
Use Warehouse for polished, governed BI solutions
Use Eventhouse for real-time operational insights
Avoid forcing one option to handle all workloads
Let business requirements—not familiarity—drive the choice
Key Takeaway For the DP-600 exam, choosing between a Lakehouse, Warehouse, or Eventhouse is about aligning data characteristics and access patterns with the right Fabric experience. Lakehouses provide flexibility, Warehouses deliver enterprise BI performance, and Eventhouses enable real-time analytics. The correct answer is almost always the one that best fits the scenario constraints.
Practice Questions:
Here are 10 questions to test and help solidify your learning and knowledge. As you review these and other questions in your preparation, make sure to …
Identifying and understand why an option is correct (or incorrect) — not just which one
Look for and understand the usage scenario of keywords in exam questions, with the below possible association:
Expect scenario-based questions rather than direct definitions
1. Which Microsoft Fabric component is BEST suited for flexible analytics on both files and tables using Spark and SQL?
A. Warehouse B. Eventhouse C. Lakehouse D. Semantic model
Correct Answer: C
Explanation: A Lakehouse stores data in Delta format in OneLake and supports both Spark and SQL, making it ideal for flexible analytics across files and tables.
2. A team of data scientists needs to experiment with raw and curated data using notebooks. Which option should they choose?
A. Warehouse B. Eventhouse C. Semantic model D. Lakehouse
Correct Answer: D
Explanation: Lakehouses are designed for data engineering and data science workloads, offering Spark-based notebooks and flexible schema handling.
3. Which option is MOST appropriate for enterprise BI reporting with well-defined schemas and strong governance?
A. Lakehouse B. Warehouse C. Eventhouse D. OneLake
Correct Answer: B
Explanation: Warehouses are SQL-first, schema-on-write systems optimized for structured data, governance, and high-performance BI reporting.
4. A solution must support near-real-time analytics on streaming IoT telemetry data. Which Fabric component should be used?
A. Lakehouse B. Warehouse C. Eventhouse D. Dataflow Gen2
Correct Answer: C
Explanation: Eventhouses are optimized for high-velocity streaming data and real-time analytics using KQL.
5. Which query language is primarily used to analyze data in an Eventhouse?
A. T-SQL B. Spark SQL C. DAX D. KQL
Correct Answer: D
Explanation: Eventhouses are built on KQL (Kusto Query Language), which is optimized for querying event and time-series data.
6. A business analytics team requires fast dashboard performance and is familiar only with SQL. Which option best meets this requirement?
A. Lakehouse B. Warehouse C. Eventhouse D. Spark notebook
Correct Answer: B
Explanation: Warehouses provide a traditional SQL experience optimized for BI dashboards and reporting performance.
7. Which characteristic BEST distinguishes a Lakehouse from a Warehouse?
A. Lakehouses support Power BI B. Warehouses store data in OneLake C. Lakehouses support Spark-based processing D. Warehouses cannot be governed
Correct Answer: C
Explanation: Lakehouses uniquely support Spark-based processing, enabling advanced transformations and data science workloads.
8. A solution must store structured batch data and unstructured files in the same analytical store. Which option should be selected?
A. Warehouse B. Eventhouse C. Semantic model D. Lakehouse
Correct Answer: D
Explanation: Lakehouses support both structured tables and unstructured or semi-structured files within the same environment.
9. Which scenario MOST strongly indicates the need for an Eventhouse?
A. Monthly financial reporting B. Slowly changing dimension modeling C. Real-time operational monitoring D. Ad hoc SQL analysis
Correct Answer: C
Explanation: Eventhouses are designed for real-time analytics on streaming data, making them ideal for operational monitoring scenarios.
10. When choosing between a Lakehouse, Warehouse, or Eventhouse on the DP-600 exam, which factor is MOST important?
A. Personal familiarity with the tool B. The default Fabric option C. Data characteristics and latency requirements D. Workspace size
Correct Answer: C
Explanation: DP-600 emphasizes selecting the correct component based on data type (batch vs streaming), latency needs, user personas, and governance—not personal preference.
Effective DAX (Data Analysis Expressions) is essential for high-performance semantic models in Microsoft Fabric. As datasets and business logic become more complex, inefficient DAX can slow down query execution and degrade report responsiveness. This article explains why DAX performance matters, common performance pitfalls, and best practices to optimize DAX in enterprise-scale semantic models.
Why DAX Performance Matters
In Fabric semantic models (Power BI datasets + Direct Lake / Import / composite models), DAX is used to define:
Measures (dynamic calculations)
Calculated columns (row-level expressions)
Calculated tables (derived data structures)
When improperly written, DAX can become a bottleneck — especially on large models or highly interactive reports (many slicers, visuals, etc.). Optimizing DAX ensures:
Faster query execution
Better user experience
Lower compute consumption
More efficient use of memory
The DP-600 exam tests your ability to identify and apply performance-aware DAX patterns.
Understand DAX Execution Engines
DAX queries are executed by two engines:
Formula Engine (FE) — processes logic that can’t be delegated
Storage Engine (SE) — processes optimized aggregations and scans
Performance improves when more computation can be done in the Storage Engine (columnar operations) rather than the Formula Engine (row-by-row logic).
Rule of thumb: Favor patterns that minimize work done in the Formula Engine.
Common DAX Performance Anti-Patterns
1. Repeated Calculations Without Variables
Example:
Total Sales + Total Cost - Total Discount
If Total Sales, Total Cost, and Total Discount all compute the same sub-expressions repeatedly, the engine may evaluate redundant logic multiple times.
Anti-Pattern:
Repeated expressions without variables.
2. Nested Iterator Functions
Using iterators like SUMX or FILTER on large tables many times in a measure increases compute overhead.
Avoid high-cardinality columns in calculations where unnecessary
Use star schema design to improve filter propagation
6. Reuse Measures
Instead of duplicating logic:
Total Profit =
[Total Sales] - [Total Cost]
Reuse basic measures within more complex logic.
7. Prefer Measures Over Calculated Columns
Measures calculate at query time and respect filter context; calculated columns are evaluated during refresh. Use calculated columns only when necessary.
8. Reduce Iterators on Large Tables
If SUMX is needed for row-level expressions, consider summarizing first or using aggregation tables.
9. Understand Evaluation Context
Complex measures often inadvertently alter filter context. Use functions like:
ALL
REMOVEFILTERS
KEEPFILTERS
…carefully, as they affect performance and results.
10. Leverage DAX Studio or Performance Analyzer
While not directly tested with UI steps, knowing when to use tools to diagnose DAX is helpful:
Why better? Explicit filtering via CALCULATETABLE often pushes more work to the Storage Engine than iterating within FILTER.
Exam-Focused Takeaways
For DP-600 questions related to DAX performance:
Identify inefficient row context patterns
Prefer variables and simple aggregations
Favor Storage Engine–friendly functions
Avoid unnecessary nested iterators
Recognize when a measure should be rewritten for performance
Summary
Improving DAX performance is about writing efficient calculations and avoiding patterns that force extra processing in the Formula Engine. By using variables, minimizing iterator overhead, simplifying filter expressions, and leveraging star schema design, you can significantly improve query responsiveness — a key capability for enterprise semantic models and the DP-600 exam.
Practice Questions:
Here are 10 questions to test and help solidify your learning and knowledge. As you review these and other questions in your preparation, make sure to …
Identifying and understand why an option is correct (or incorrect) — not just which one
Look for and understand the usage scenario of keywords in exam questions to guide you
Expect scenario-based questions rather than direct definitions
Question 1
You have a DAX measure that repeats the same complex calculation multiple times. Which change is most likely to improve performance?
A. Convert the calculation into a calculated column B. Use a DAX variable (VAR) to store the calculation result C. Replace CALCULATE with SUMX D. Enable bidirectional relationships
Correct Answer: B
Explanation: DAX variables evaluate their expression once per query context and reuse the result. This avoids repeated execution of the same logic and reduces Formula Engine overhead, making variables one of the most effective performance optimization techniques.
Question 2
Which aggregation function is generally the most performant when no row-by-row logic is required?
A. SUMX B. AVERAGEX C. SUM D. FILTER
Correct Answer: C
Explanation: Native aggregation functions like SUM, COUNT, and AVERAGE are optimized to run in the Storage Engine, which is much faster than iterator-based functions such as SUMX that require row-by-row evaluation in the Formula Engine.
Question 3
Why is this DAX pattern potentially slow on large tables?
A. FILTER disables relationship filtering B. FILTER forces evaluation in the Formula Engine C. CALCULATE cannot push filters to the Storage Engine D. The expression produces incorrect results
Correct Answer: B
Explanation: The FILTER function iterates over rows, forcing Formula Engine execution. When possible, using simple Boolean expressions inside CALCULATE (e.g., FactSales[SalesAmount] > 1000) allows the Storage Engine to handle filtering more efficiently.
Question 4
Which CALCULATE filter expression is more performant?
A. FILTER(Sales, Sales[Year] = 2024) B. Sales[Year] = 2024 C. ALL(Sales[Year]) D. VALUES(Sales[Year])
Correct Answer: B
Explanation: Simple Boolean filters allow DAX to push work to the Storage Engine, while FILTER requires row-by-row evaluation. This distinction is frequently tested on the DP-600 exam.
Question 5
Which practice helps reduce the Formula Engine workload?
A. Using nested iterator functions B. Replacing measures with calculated columns C. Reusing base measures in more complex calculations D. Increasing column cardinality
Correct Answer: C
Explanation: Reusing base measures promotes efficient evaluation plans and avoids duplicated logic. Nested iterators and high cardinality columns increase computational complexity and slow down queries.
Question 6
Which modeling choice can indirectly improve DAX query performance?
A. Using snowflake schemas B. Increasing the number of calculated columns C. Removing unused columns and tables D. Enabling bidirectional relationships by default
Correct Answer: C
Explanation: Removing unused columns reduces memory usage, dictionary size, and scan costs. Smaller models lead to faster Storage Engine operations and improved overall query performance.
Question 7
Which DAX pattern is considered a performance anti-pattern?
A. Using measures instead of calculated columns B. Using SUMX when SUM would suffice C. Using star schema relationships D. Using single-direction filters
Correct Answer: B
Explanation: Iterator functions like SUMX should only be used when row-level logic is required. Replacing simple aggregations with iterators unnecessarily shifts work to the Formula Engine.
Question 8
Why can excessive use of EARLIER negatively impact performance?
A. It prevents relationship traversal B. It creates complex nested row contexts C. It only works in measures D. It disables Storage Engine scans
Correct Answer: B
Explanation: EARLIER introduces nested row contexts that are difficult for the DAX engine to optimize. Modern DAX best practices recommend using variables instead of EARLIER.
Question 9
Which relationship configuration can negatively affect DAX performance if overused?
A. Single-direction filtering B. Many-to-one relationships C. Bidirectional filtering D. Active relationships
Correct Answer: C
Explanation: Bidirectional relationships increase filter propagation paths and query complexity. While useful in some scenarios, overuse can significantly degrade performance in enterprise-scale models.
Question 10
Which tool should you use to identify slow visuals caused by inefficient DAX measures?
A. Power Query Editor B. Model View C. Performance Analyzer D. Deployment Pipelines
Correct Answer: C
Explanation: Performance Analyzer captures visual query durations, DAX query times, and rendering times, making it the primary tool for diagnosing DAX and visual performance issues in Power BI and Fabric semantic models.
Excel Power Query is a powerful, no-code/low-code tool that allows you to combine and transform data from multiple sources in a repeatable and refreshable way. One common use case is merging two Excel files or worksheets based on multiple matching columns, similar to a SQL join. Power Query is a major part of Power BI, but it can be used in Excel.
When to Use Power Query for Merging
Power Query is ideal when:
You receive recurring Excel files with the same structure
You need a reliable, refreshable merge process
You want to avoid complex formulas like VLOOKUP or XLOOKUP across many columns
Step-by-Step Overview
1. Load Both Data Sources into Power Query
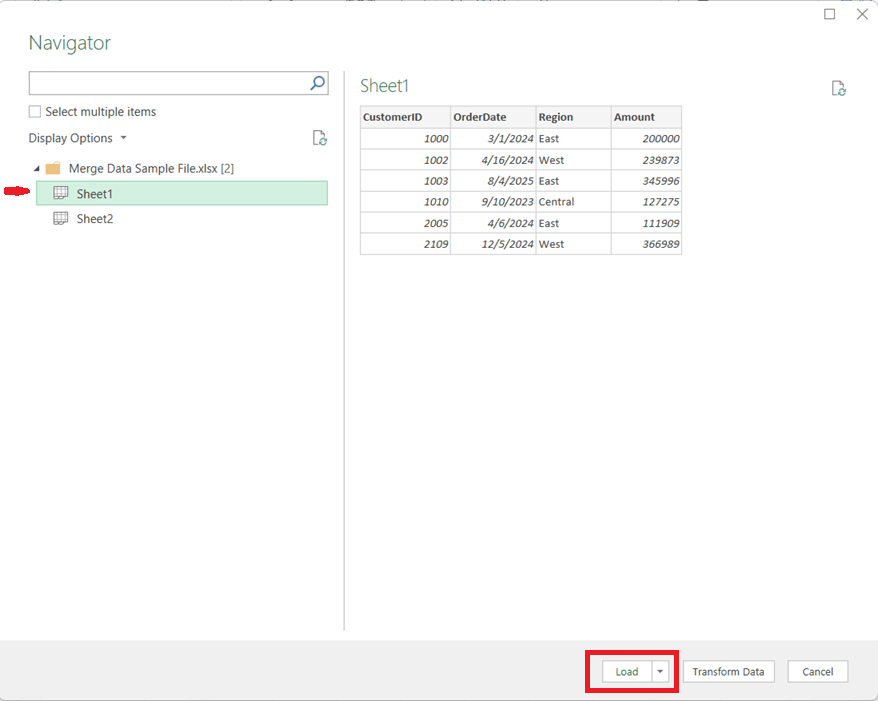
Open Excel and go to Data → Get Data
Choose From Workbook (for separate files) or From Table/Range (for sheets in the same file)
Tip: Ensure the columns you plan to merge on have the same data types (e.g., text vs. number).
Load each dataset into Power Query as a separate query
2. Start the Merge Operation
In Power Query, select the primary table
Go to Query → Merge Queries
Choose the secondary table from the dropdown
3. Select Multiple Matching Columns
Click the first matching column in the primary table
Hold Ctrl (or Cmd on Mac) and select additional matching columns
Repeat the same column selections in the secondary table, in the same order
For example, if you needed to perform the merge on CustomerID, OrderDate, and Region, you would click Customer ID, then hold the Ctrl key and click OrderDate, then (while still holding down the Ctrl key) click Region.
Power Query treats this as a composite key, and all selected columns must match for rows from both tables to merge.
4. Choose the Join Type
Select the appropriate join kind:
Left Outer – Keep all rows from the first table (most common) and brings in the values for the matching rows from the second table
Inner – Keep only matching rows from both tables
Full Outer – Keep all rows from both tables, merging the table where there is a match and having just the values from the respective tables when there is no match
Click OK to complete the merge.
5. Expand the Merged Data
A new column appears containing nested tables
Click the expand icon to select which columns to bring in
Remove unnecessary columns to keep the dataset clean
6. Load and Refresh
Click Close & Load
The merged dataset is now available in Excel
When source files change, simply click Refresh to update everything automatically
Key Benefits
Handles multi-column joins cleanly and reliably
Eliminates fragile lookup formulas
Fully refreshable and auditable
Scales well as data volume grows
In Summary
Using Power Query to merge Excel data on multiple columns brings database-style joins into Excel, making your workflows more robust, maintainable, and professional. Once set up, it saves time and reduces errors—especially for recurring reporting and analytics tasks.
When working with data in Power BI, it’s common to need to combine, compare, or filter tables based on their rows. DAX provides three powerful table / set functions for this: UNION, INTERSECT, and EXCEPT.
These functions are especially useful in advanced calculations, comparative analysis, and custom table creation in reports. If you have used these functions in SQL, the concepts here will be familiar.
Sample Dataset
We’ll use the following two tables throughout our examples:
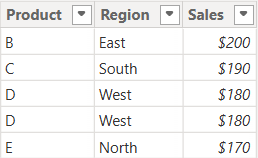
Table: Sales_2024
The above table (Sales_2024) was created using the following DAX code utilizing the DATATABLE function (or you could enter the data directly using the Enter Data feature in Power BI):
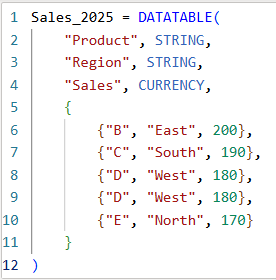
Table: Sales_2025
The above table (Sales_2025) was created using the following DAX code utilizing the DATATABLE function (or you could enter the data directly using the Enter Data feature in Power BI):
Now that we have our two test tables, we can now use them to explore the 3 table / set functions – Union, Intersect, and Except.
1. UNION – Combine Rows from Multiple Tables
The UNION function returns all rows from both tables, including duplicates. It requires the same number of columns and compatible data types in corresponding columns in the the tables being UNION’ed. The column names do not have to match, but the number of columns and datatypes need to match.
DAX Syntax:
UNION(<Table1>, <Table2>)
For our example, here is the syntax and resulting dataset:
UnionTable = UNION(Sales_2024, Sales_2025)
As you can see, the UNION returns all rows from both tables, including duplicates.
If you were to reverse the order of the tables (in the function call), the result remains the same (as shown below):
To remove duplicates, you can wrap the UNION inside a DISTINCT() function call, as shown below:
2. INTERSECT – Returns Rows Present in Both Tables
The INTERSECT function returns only the rows that appear in both tables (based on exact matches across all columns).
DAX Syntax:
INTERSECT(<Table1>, <Table2>)
For our example, here is the syntax and resulting dataset:
In this case, it returns only the rows in Sales_2025 that are also found in Sales_2024. Since the record with “D – West – $180” exists twice in Sales_2025, and also exists in Sales_2024, then both records are returned. So, while it might not be relevant for all datasets, order does matter when using INTERSECT.
3. EXCEPT – Returns Rows in One Table but Not the Other
The EXCEPT function returns rows from the first table that do not exist in the second.
DAX Syntax:
EXCEPT(<Table1>, <Table2>)
For our example, here is the syntax and resulting dataset:
ExceptTable = EXCEPT(Sales_2024, Sales_2025)
Only the rows in Sales_2024 that are not in Sales_2025 are returned.
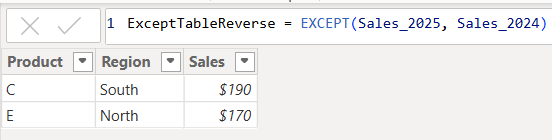
If you were to reverse the order of the tables, you would get the following result:
Only the rows in Sales_2025 that are not in Sales_2024 are returned. Therefore, as you have seen, since it pulls data from the first table that does not exist in the second, order does matter when using EXCEPT.
Comparison table summarizing the 3 functions:
Function
UNION
INTERSECT
EXCEPT
Purpose & Output
Returns all rows from both tables
Returns rows that appear in both tables (i.e., rows that match across all columns in both tables)
Returns rows from the first table that do not exist in the second
Match Criteria
Column position (number of columns) and datatypes
Column position (number of columns) and datatypes and values
Column position (number of columns) and datatypes must match and values must not match
Order Sensitivity
order does not matter
order matters if you want duplicates returned when they exist in the first table
order matters
Duplicate Handling
Keeps duplicates. They can be removed by using DISTINCT()
Returns duplicates only if they exist in the first table
Returns duplicates only if they exist in the first table
Additional Notes for your consideration:
Column Names: Only the column names from the first table are kept; the second table’s columns must match in count and data type.
Performance: On large datasets, these functions can be expensive, so you should consider filtering the data before using them.
Case Sensitivity: String comparisons are generally case-insensitive in DAX.
Real-World Use Cases:
UNION – Combining a historical dataset and a current dataset for analysis.
INTERSECT – Finding products sold in both years.
EXCEPT – Identifying products discontinued or newly introduced.
If you need to build insert statements for many rows of data for inserting that data into another table or into the same table in a different environment, there is a convenient way to do this in Toad. This is often needed to move data around.
In Toad, execute the appropriate select statement on the source table …
Select * from [my_schema].[my_simple_table];
I used a simple “select *” above, but your SQL statement can be any valid SQL statement that returns the data you want to insert into the other table. You may add specific columns, add filters, joins, and any other valid SQL operation.
Let’s say you want to insert the output into another table in a different schema.
Right-click on the output result data, and click “Export Dataset…”
From the “Export format” drop down menu, choose “Insert Statements”
In the Output section of the Export Dataset dialog box, enter the location and name of the Insert Script file that will be generated.
There are several other parameters that you could choose but we won’t cover them all here.
If you only wanted to generate inserts for some selected rows, select “Export only selected rows”.
If you need to specify the schema of the target table, select “Include schema name”
In the Table section, enter the name of the target schema and table
Note, there are data masking options available that can be very useful if, for example, you are moving some data from a Production environment to a Non-Production environment, and you do not want to expose the data there.
After you have set the parameters relevant to your scenario, Click “OK”.
The Insert Script file of all the data will be generated with the filename and at the location you specified. And the insert statements will include the name of the schema and table you specified.
Data cleaning is an essential step in the data preprocessing pipeline when preparing data for analytics or data science. It involves identifying and correcting or removing errors, inconsistencies, and inaccuracies in the dataset to improve its quality and reliability. It is essential that data is cleaned before being used in analyses, reporting, development or integration. Here are some common data cleaning methods:
Handling missing values:
Delete rows or columns with a high percentage of missing values if they don’t contribute significantly to the analysis.
Impute missing values by replacing them with a statistical measure such as mean, median, mode, or using more advanced techniques like regression imputation or k-nearest neighbors imputation.
Handling categorical variables:
Encode categorical variables into numerical representations using techniques like one-hot encoding, label encoding, or target encoding.
Removing duplicates:
Identify and remove duplicate records based on one or more key variables.
Be cautious when removing duplicates, as sometimes duplicated entries may be valid and intentional.
Handling outliers:
Identify outliers using statistical methods like z-scores, box plots, or domain knowledge.
Decide whether to remove outliers or transform them based on the nature of the data and the analysis goals.
Correcting inconsistent data:
Standardize data formats: Convert data into a consistent format (e.g., converting dates to a specific format).
Resolve inconsistencies: Identify and correct inconsistent values (e.g., correcting misspelled words, merging similar categories).
Dealing with irrelevant or redundant features:
Remove irrelevant features that do not contribute to the analysis or prediction task.
Identify and handle redundant features that provide similar information to avoid multicollinearity issues.
Data normalization or scaling:
Normalize numerical features to a common scale (e.g., min-max scaling or z-score normalization) to prevent certain features from dominating the analysis due to their larger magnitudes.
Data integrity issues:
Finally, you need to address data integrity issues.
Check for data integrity problems such as inconsistent data types, incorrect data ranges, or violations of business rules.
Resolve integrity issues by correcting or removing problematic data.
It’s important to note that the specific data cleaning methods that need to be applied to a dataset will vary depending on the nature of the dataset, the analysis goals, and domain knowledge. It’s recommended to thoroughly understand the data and consult with domain experts when preparing to perform data cleaning tasks.
Information and resources for the data professionals' community