This post is a part of the PL-300: Microsoft Power BI Data Analyst Exam Prep Hub; and this topic falls under these sections:
Manage and secure Power BI (15–20%)
   --> Secure and govern Power BI items
      --> Implement row-level security roles

Below are 10 practice questions (with answers and explanations) for this topic of the exam.
There are also 2 practice tests for the PL-300 exam with 60 questions each (with answers) available on the hub.
Practice Questions
Question 1
Where are Row-Level Security roles and filters created?
A. In the Power BI Service B. In Power BI Desktop C. In Microsoft Entra ID D. In Power BI Apps
Correct Answer:B
Explanation: RLS roles and DAX filters are created in Power BI Desktop. Users and groups are assigned to those roles later in the Power BI Service.
Question 2
Which DAX function is most commonly used to implement dynamic RLS?
A. USERELATIONSHIP() B. USERNAME() C. USERPRINCIPALNAME() D. SELECTEDVALUE()
Correct Answer:C
Explanation: USERPRINCIPALNAME() returns the logged-in user’s email/UPN and is the most commonly used function for dynamic RLS scenarios.
Question 3
A single semantic model must filter sales data so that users only see rows matching their email address. What is the best approach?
A. Create one role per user B. Create static RLS roles by region C. Use dynamic RLS with a user-mapping table D. Use Object-Level Security
Correct Answer:C
Explanation: Dynamic RLS with a user-to-dimension mapping table scales efficiently and avoids creating many static roles.
Question 4
What happens if a user belongs to multiple RLS roles?
A. Access is denied B. Only the most restrictive role is applied C. The union of all role filters is applied D. The first role alphabetically is applied
Correct Answer:C
Explanation: Power BI applies the union of RLS role filters, meaning users see data allowed by any role they belong to.
Question 5
Which statement about Row-Level Security behavior is correct?
A. RLS is applied at the report level B. RLS applies only to dashboards C. RLS is enforced at the semantic model level D. RLS must be reconfigured for each report
Correct Answer:C
Explanation: RLS is enforced at the semantic model level and automatically applies to all reports and apps using that model.
Question 6
You test RLS using View as role in Power BI Desktop. What does this feature do?
A. Permanently applies RLS to the model B. Bypasses RLS for the model author C. Simulates how the report appears for a role D. Assigns users to roles automatically
Correct Answer:C
Explanation: View as allows you to simulate role behavior to validate RLS logic before publishing.
Question 7
Which type of RLS is least scalable in enterprise environments?
A. Dynamic RLS B. RLS using USERPRINCIPALNAME() C. Static RLS with hard-coded values D. Group-based RLS
Correct Answer:C
Explanation: Static RLS requires separate roles for each data segment, making it difficult to maintain at scale.
Question 8
A user accesses a report through a Power BI App. How does RLS behave?
A. RLS is ignored B. RLS must be redefined in the app C. RLS is enforced automatically D. Only static RLS is enforced
Correct Answer:C
Explanation: RLS is always enforced at the semantic model level, including when content is accessed through apps.
Question 9
Which security feature should be used if you need to hide entire columns or tables from certain users?
A. Row-Level Security B. Workspace roles C. Object-Level Security D. Build permission
Correct Answer:C
Explanation: RLS controls rows only. Object-Level Security (OLS) is used to hide tables or columns.
Question 10
Which best practice is recommended when assigning users to RLS roles?
A. Assign individual users directly B. Assign workspace Admins only C. Assign Microsoft Entra ID security groups D. Assign report-level permissions
Correct Answer:C
Explanation: Using security groups improves scalability, governance, and ease of maintenance.
Final PL-300 Exam Reminders
RLS controls data visibility, not report access
Dynamic RLS is heavily tested
RLS applies everywhere the semantic model is used
Users see the union of multiple roles
RLS is defined in Desktop, enforced in the Service
This post is a part of the DP-600: Implementing Analytics Solutions Using Microsoft Fabric Exam Prep Hub; and this topic falls under these sections:
Implement and manage semantic models (25-30%)
    --> Optimize enterprise-scale semantic models
        --> Implement performance improvements in queries and report visuals
Practice Questions:
Here are 10 questions to test and help solidify your learning and knowledge. As you review these and other questions in your preparation, make sure to …
Identifying and understand why an option is correct (or incorrect) — not just which one
Look for and understand the usage scenario of keywords in exam questions to guide you
Expect scenario-based questions rather than direct definitions
1. A Power BI report built on a large semantic model is slow to respond. Performance Analyzer shows long DAX query times but minimal visual rendering time. Where should you focus first?
A. Reducing the number of visuals B. Optimizing DAX measures and model design C. Changing visual types D. Disabling report interactions
✅ Correct Answer: B
Explanation: If DAX query time is the bottleneck, the issue lies in measure logic, relationships, or model design, not visuals.
2. Which storage mode typically provides the best interactive performance for large Delta tables stored in OneLake?
A. Import B. DirectQuery C. Direct Lake D. Live connection
✅ Correct Answer: C
Explanation: Direct Lake queries Delta tables directly in OneLake, offering better performance than DirectQuery while avoiding full data import.
3. Which modeling change most directly improves query performance in enterprise-scale semantic models?
A. Using many-to-many relationships B. Converting snowflake schemas to star schemas C. Increasing column cardinality D. Enabling bidirectional filtering
✅ Correct Answer: B
Explanation: A star schema simplifies joins and filter propagation, improving both storage engine efficiency and DAX performance.
4. A measure uses multiple nested SUMX and FILTER functions over a large fact table. Which change is most likely to improve performance?
A. Replace the measure with a calculated column B. Introduce DAX variables to reuse intermediate results C. Add more visuals to cache results D. Convert the table to DirectQuery
✅ Correct Answer: B
Explanation: Using DAX variables (VAR) prevents repeated evaluation of expressions, significantly improving formula engine performance.
5. Which practice helps reduce memory usage and improve performance in Import mode models?
A. Keeping all columns for future use B. Increasing the number of calculated columns C. Removing unused columns and tables D. Enabling Auto Date/Time for all tables
✅ Correct Answer: C
Explanation: Removing unused columns reduces model size, memory consumption, and scan time, improving overall performance.
6. What is the primary benefit of using aggregation tables in composite models?
A. They eliminate the need for relationships B. They allow queries to be answered without scanning detailed fact tables C. They automatically optimize visuals D. They replace Direct Lake storage
✅ Correct Answer: B
Explanation: Aggregation tables allow Power BI to satisfy queries using pre-summarized Import data, avoiding expensive scans of large fact tables.
7. Which visual design choice is most likely to degrade report performance?
A. Using explicit measures B. Limiting visuals per page C. Using high-cardinality fields in slicers D. Using report-level filters
✅ Correct Answer: C
Explanation: Slicers on high-cardinality columns generate expensive queries and increase interaction overhead.
8. When optimizing report interactions, which action can improve performance without changing the data model?
A. Enabling all cross-highlighting B. Disabling unnecessary visual interactions C. Adding calculated tables D. Switching to DirectQuery
✅ Correct Answer: B
Explanation: Disabling unnecessary visual interactions reduces the number of queries triggered by user actions.
9. Which DAX practice is recommended for improving performance in enterprise semantic models?
A. Use implicit measures whenever possible B. Prefer calculated columns over measures C. Minimize row context and iterators on large tables D. Use ALL() in every calculation
✅ Correct Answer: C
Explanation: Iterators and row context are expensive on large tables. Minimizing their use improves formula engine efficiency.
10. Performance Analyzer shows fast query execution but slow visual rendering. What is the most likely cause?
A. Inefficient DAX measures B. Poor relationship design C. Too many or overly complex visuals D. Incorrect storage mode
✅ Correct Answer: C
Explanation: When rendering time is high but queries are fast, the issue is usually visual complexity, not the model or DAX.
Power BI includes a feature called Auto date/time that automatically creates hidden date tables for date columns in your model. While this can be helpful for quick analyses, it can also introduce performance issues and modeling complexity in more advanced or production-grade reports.
What Is Auto Date/Time?
When Auto date/time is enabled, Power BI automatically generates a hidden date table for every column of type Date or Date/Time. These tables allow you to use built-in time intelligence features (like Year, Quarter, and Month) without explicitly creating a calendar table.
Why Turn Off Auto Date/Time?
Disabling Auto date/time is often considered a best practice for the following reasons:
Better Performance Each date column gets its own hidden date table, which increases model size and can slow down report performance.
Cleaner Data Models Hidden tables can clutter the model and make debugging DAX calculations more difficult.
Consistent Time Intelligence Using a single, well-designed Date (Calendar) table ensures consistent logic across all measures and visuals.
More Control Custom calendar tables allow you to define fiscal years, custom week logic, holidays, and other business-specific requirements.
How to Turn Off Auto Date/Time in Power BI
You can disable Auto date/time in both Power BI Desktop and at the report level:
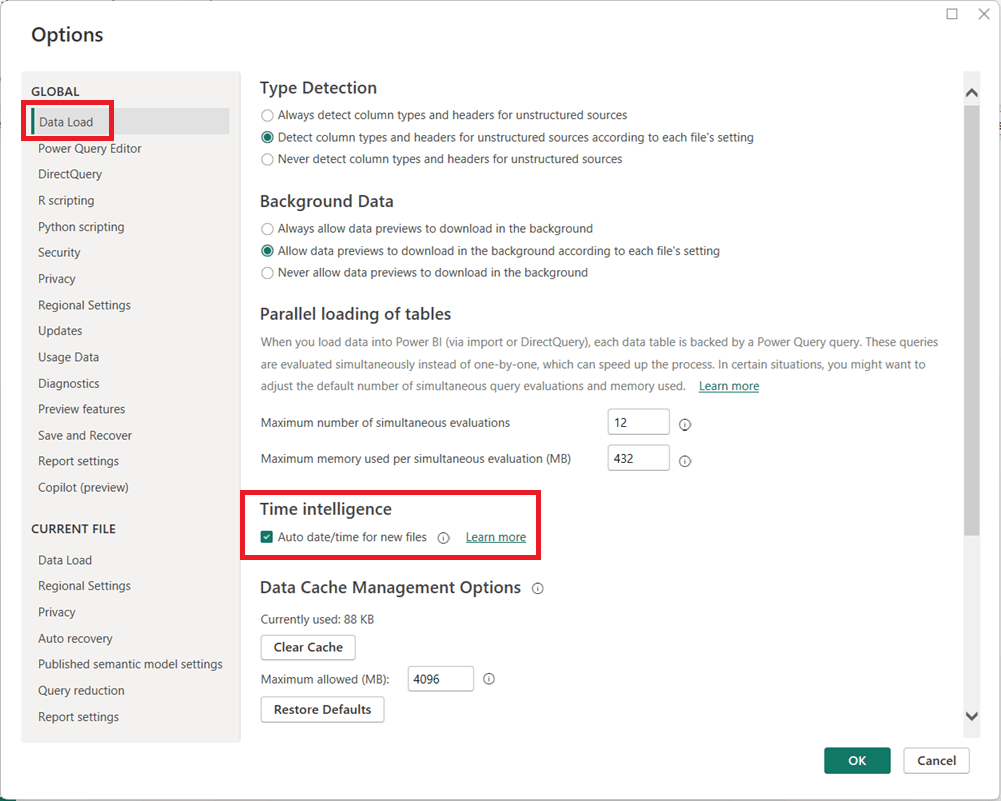
In Power BI Desktop, go to File → Options and settings → Options.
Under Global, select Data Load.
Uncheck Auto date/time for new files.
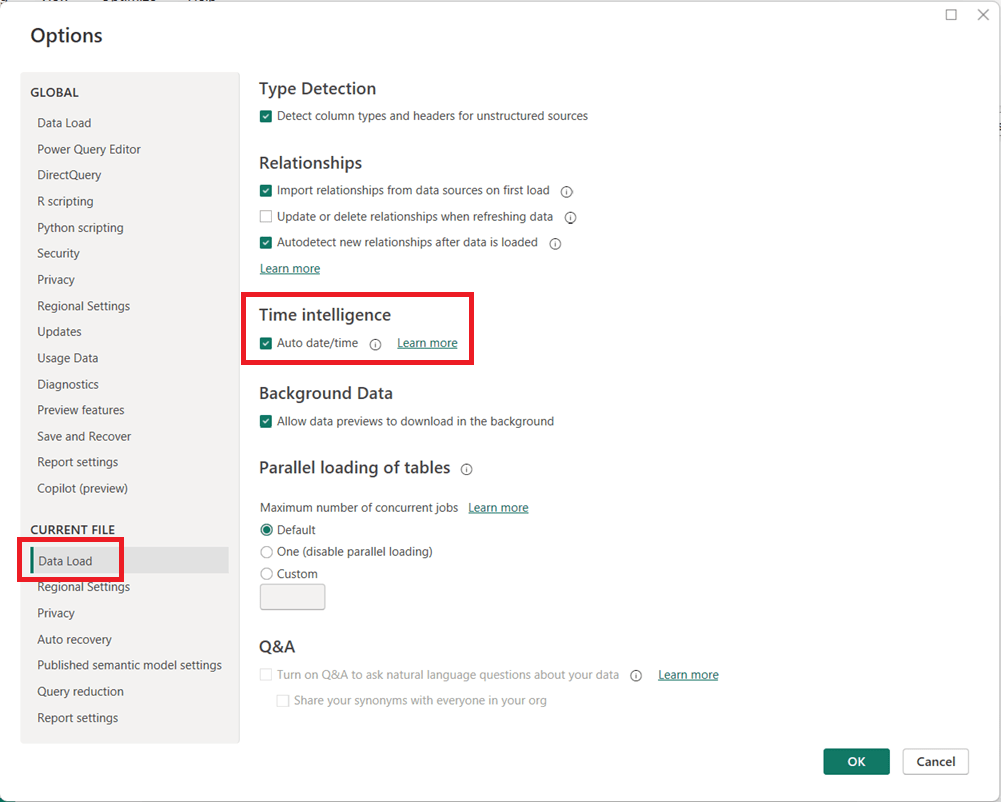
(Optional but recommended) Under Current File, select Data Load and uncheck Auto date/time to disable it for the current report.
Click OK and refresh your model if necessary.
When Should You Leave It On?
Auto date/time can still be useful for:
Quick prototypes or ad-hoc analysis
Simple models with only one or two date fields
Users new to Power BI who are not yet working with custom DAX time intelligence
Final Thoughts
For enterprise, reusable, or performance-sensitive Power BI models, turning off Auto date/time and using a dedicated Date table is usually the better approach. It leads to cleaner models, more reliable calculations, and greater long-term flexibility as your reports grow in complexity.
As we close out 2025, it’s clear that the global data landscape has continued its unprecedented expansion — touching every part of life, business, and technology. From raw bytes generated every second to the ways that AI reshapes how we search, communicate, and innovate, this year has marked another seismic leap forward for data. Below is a comprehensive look at where we stand — and where things appear to be headed as we approach 2026.
🌐 Global Data Generation: A Tidal Wave
Amount of Data Generated
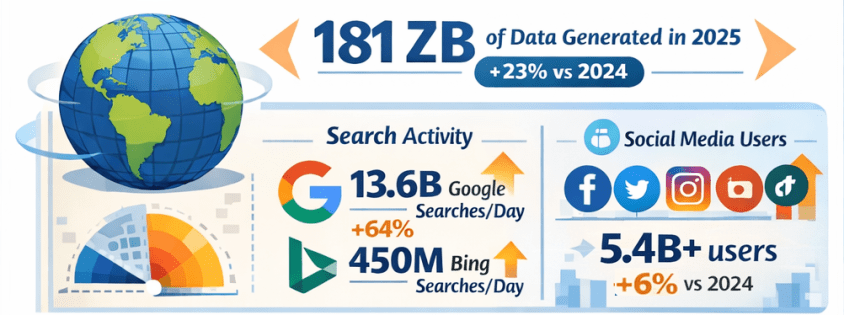
In 2025, the total volume of data created, captured, copied, and consumed globally is forecast to reach approximately 181 zettabytes (ZB) — up from about 147 ZB in 2024, representing roughly 23% year-over-year growth. Gitnux+1
That equates to an astonishing ~402 million terabytes of data generated daily. Exploding Topics
Growth Comparison: 2024 vs 2025
Data is growing at a compound rate: from roughly 120 ZB in 2023 to 147 ZB in 2024, then to about 181 ZB in 2025 — illustrating an ongoing surge of data creation driven by digital adoption and connected devices. Exploding Topics+1
🔍 Internet Users & Search Behavior
Number of People Online
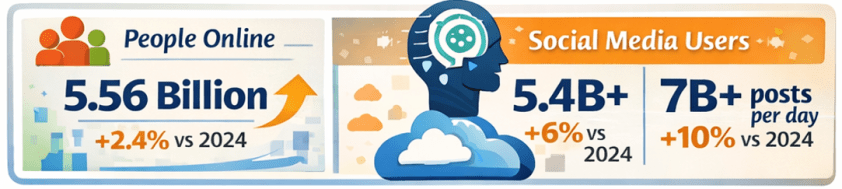
As of early 2025, around 5.56 billion people are active internet users, accounting for nearly 68% of the global population — up from approximately 5.43 billion in 2024. DemandSage
Search Engine Activity
Google alone handles roughly 13.6 billion searches per day in 2025, totaling almost 5 trillion searches annually — a significant increase from the estimated 8.3 billion daily searches in 2024. Exploding Topics
Bing, while much smaller in scale, processes around 450+ million searches per day (~13–14 billion per month). Nerdynav
Market Share Snapshot
Google continues to dominate search with approximately 90% global market share, while Bing remains one of the top alternatives. StatCounter Global Stats
📱 Social Media Usage & Content Creation
User Numbers
There are roughly 5.4–5.45 billion social media users worldwide in 2025 — up from prior years and covering about 65–67% of the global population. XtendedView+1
Time Spent & Trends
Users spend on average about 2 hours and 20+ minutes per day on social platforms. SQ Magazine
AI plays a central role in content recommendations and creation, with 80%+ of social feeds relying on algorithms, and an increasing share of generated images and posts assisted by AI tools. SQ Magazine
📊 The Explosion of AI: LLMs & Tools
LLM Adoption
Large language models and AI assistants like ChatGPT have become globally pervasive:
ChatGPT alone has around 800 million weekly active users as of late 2025. First Page Sage
Daily usage figures exceed 2.5 billion user prompts globally, highlighting a massive shift toward direct AI interaction. Exploding Topics
Studies have shown that LLM-assisted writing and content creation are now embedded across formal and informal communication channels, indicating broad adoption beyond curiosity use cases. arXiv
AI Tools Everywhere
Generative AI is now a staple across industries — from content creation to customer service, data analytics to software development. Investments and usage in AI-powered analytics and automation tools continue to rise rapidly. layerai.org
💡 Trends in Data Collection & Analytics
Real-Time & Edge Processing
In 2025, more than half of corporate data processing is happening at the edge, closer to the source of data generation, enabling real-time insights. Pennsylvania Institute of Technology
Data Democratization
Data access and analytics tools have become more user-friendly, with low-code/no-code platforms enabling broader organizational participation in data insight generation. postlo.com
☁️ Cloud & Data Infrastructure
Cloud Data Growth
An ever-increasing portion of global data is stored in the cloud, with estimates suggesting around half of all data resides in cloud environments by 2025. Axis Intelligence
Data Centers & Energy
Data centers, particularly those supporting AI workloads, are expanding rapidly. This infrastructure surge is driving both innovation and concerns — including power consumption and sustainability challenges. TIME
📜 Data Laws & Regulation
New Legal Frameworks
In the UK, the Data (Use and Access) Act of 2025 was enacted, updating data protection and access rules related to UK-specific GDPR implementations. Wikipedia
Elsewhere, data regulation remains a focal point globally, with ongoing debates around privacy, governance, AI accountability, and cross–border data flows.
🛠️ Top Data Tools/Platforms of 2025
While specific rankings vary by industry and use case, 2025’s data ecosystem centers around:
Cloud data platforms: Snowflake, BigQuery, Redshift, Databricks
Ongoing trends emphasize integration between AI tooling and traditional analytics pipelines — blurring the lines between data engineering, analytics, and automation.
Note: specific tool adoption percentages vary by firm size and sector, but cloud-native and AI-augmented tools dominate enterprise workflows.Reddit
🌟 Novel Uses of Data in 2025
2025 saw innovative applications such as:
AI-powered disaster response using real-time social data streams.
Conversational assistants embedded into everyday workflows (search, writing, decision support).
Predictive analytics in health, finance, logistics, accelerated by real-time IoT feeds.
Synthetic datasets for simulation, security research, and model training. arXiv
🔮 What’s Expected in 2026
Continued Growth
Data volumes are projected to keep rising — potentially doubling every few years with the proliferation of AI, IoT, and immersive technologies.
LLM adoption will likely hit deeper integration into enterprise processes, customer experience workflows, and consumer tech.
AI governance and data privacy regulation will intensify globally, balancing innovation with accountability.
Emerging Frontiers
Multimodal AI blending text, vision, and real-time sensor data.
Federated learning and privacy-preserving analytics gaining traction.
Data meshes and decentralized data infrastructures challenging traditional monolithic systems.
Unified data platforms with AI-focused features and AI-focused business-ready data models are becoming common place.
📌 Final Thoughts
2025 has been another banner year for data — not just in sheer scale, but in how data powers decision-making, AI capabilities, and digital interactions across society. From trillions of searches to billions of social interactions, from zettabytes of oceans of data to democratized analytics tools, the data world continues to evolve at breakneck speed. And for data professionals and leaders, the next year promises even more opportunities to harness data for insight, innovation, and impact. Exciting stuff!
A Quick Guide through some of the top data certifications for 2026
As data platforms continue to converge analytics, engineering, and AI, certifications in 2026 are less about isolated tools and more about end-to-end data value delivery. The certifications below stand out because they align with real-world enterprise needs, cloud adoption, and modern data architectures.
Each certification includes:
What it is
Why it’s important in 2026
How to achieve it
Difficulty level
1. DP-600: Microsoft Fabric Analytics Engineer Associate
What it is
DP-600 validates skills in designing, building, and deploying analytics solutions using Microsoft Fabric, including lakehouses, data warehouses, semantic models, and Power BI.
Why it’s important
Microsoft Fabric represents Microsoft’s unified analytics vision, merging data engineering, BI, and governance into a single SaaS platform. DP-600 is quickly becoming one of the most relevant certifications for analytics professionals working in Microsoft ecosystems.
It’s especially valuable because it:
Bridges data engineering and analytics
Emphasizes business-ready semantic models
Aligns directly with enterprise Power BI adoption
How to achieve it
Study Fabric concepts: OneLake, Lakehouse, Warehouse, Dataflows Gen2, semantic models
Practice impact analysis, security, deployment pipelines, and governance
This is your one-stop hub with information for preparing for the DP-600: Implementing Analytics Solutions Using Microsoft Fabric certification exam. Upon successful completion of the exam, you earn the Fabric Analytics Engineer Associate certification.
This hub provides information directly here, links to a number of external resources, tips for preparing for the exam, practice tests, and section questions to help you prepare. Bookmark this page and use it as a guide to ensure that you are fully covering all relevant topics for the exam and using as many of the resources available as possible. We hope you find it convenient and helpful.
Why do the DP-600: Implementing Analytics Solutions Using Microsoft Fabric exam to gain the Fabric Analytics Engineer Associate certification?
Most likely, you already know why you want to earn this certification, but in case you are seeking information on its benefits, here are a few: (1) there is a possibility for career advancement because Microsoft Fabric is a leading data platform used by companies of all sizes, all over the world, and is likely to become even more popular (2) greater job opportunities due to the edge provided by the certification (3) higher earnings potential, (4) you will expand your knowledge about the Fabric platform by going beyond what you would normally do on the job and (5) it will provide immediate credibility about your knowledge, and (6) it may, and it should, provide you with greater confidence about your knowledge and skills.
Important DP-600 resources:
In the section below this one, titled “DP-600: Skills measured as of October 31, 2025“, you will find the “skills measured” topics from the official study guide with links to exam preparation content for each topic. Bookmark this page and use that section as a structured topic-by-topic guide for your prep.
This page provides information for preparing for, practicing for, and registering for the exam. The skills measured content in the guide is also what is used to form the “Skills Measured as of …” outline below.
About the exam:
Cost: US $165
Number of questions: approximately 60
Time to do exam: 120 minutes (2 hours)
To Do’s:
Schedule time to learn, study, perform labs, and do practice exams and questions
Schedule the exam based on when you think you will be ready; scheduling the exam gives you a target and drives you to keep working on it
Use the various resources above and below to learn
Take the free Microsoft Learn practice test, any other available practice tests, and do the practice questions in each section and the two practice tests available in this hub.
Link to the free, comprehensive, self-paced course: Microsoft Learn course for a Microsoft Fabric Analytics Engineer. It contains 4 Learning Paths, each with multiple Modules, and each module has multiple Units. It will take some time to do it, but we recommend that you complete this entire course, including the exercises/labs. To help you work through your preparation in a structured manner, we will point you to the relevant sections in the training material corresponding to each of the sections in the skills measured section below.
Here you can learn in a structured manner by going through the topics of the exam one-by-one to ensure full coverage; click on each hyperlinked topic below to go to more information about it:
Good luck to you passing the DP-600: Implementing Analytics Solutions Using Microsoft Fabric certification exam and earning the Fabric Analytics Engineer Associate certification!
A composite model in Power BI and Microsoft Fabric combines data from multiple data sources and multiple storage modes in a single semantic model. Rather than importing all data into the model’s in-memory cache, composite models let you mix different query/storage patterns such as:
Import
DirectQuery
Direct Lake
Live connections
Composite models enable flexible design and optimized performance across diverse scenarios.
Why Composite Models Matter
Semantic models often need to support:
Large datasets that cannot be imported fully
Real-time or near-real-time requirements
Federation across disparate sources
Mix of highly dynamic and relatively static data
Composite models let you combine the benefits of in-memory performance with direct source access.
Core Concepts
Storage Modes in Composite Models
Storage Mode
Description
Typical Use
Import
Data is cached in the semantic model memory
Fast performance for static or moderately sized data
DirectQuery
Queries are pushed to the source at runtime
Real-time or large relational sources
Direct Lake
Queries Delta tables in OneLake
Large OneLake data with faster interactive access
Live Connection
Delegates all query processing to an external model
Shared enterprise semantic models
A composite model may include tables using different modes — for example, imported dimension tables and DirectQuery/Direct Lake fact tables.
Key Features of Composite Models
1. Table-Level Storage Modes
Every table in a composite model may use a different storage mode:
Dimensions may be imported
Fact tables may use DirectQuery or Direct Lake
Bridge or helper tables may be imported
This flexibility enables performance and freshness trade-offs.
2. Relationships Across Storage Modes
Relationships can span tables even if they use different storage modes, enabling:
Filtering between imported and DirectQuery tables
Cross-mode joins (handled intelligently by the engine)
Underlying engines push queries to the appropriate source (SQL, OneLake, Semantic layer), depending on where the data resides.
3. Aggregations and Hierarchies
You can define:
Aggregated tables (pre-summarized import tables)
Detail tables (DirectQuery or Direct Lake)
Power BI automatically uses aggregations when a visual’s query can be satisfied with summary data, enhancing performance.
4. Calculation Groups and Measures
Composite models work with complex semantic logic:
Calculation groups (standardized transformations)
DAX measures that span imported and DirectQuery tables
These models require careful modeling to ensure that context transitions behave predictably.
When to Use Composite Models
Composite models are ideal when:
A. Data Is Too Large to Import
Large fact tables (> hundreds of millions of rows)
Delta/OneLake data too big for full in-memory import
Use Direct Lake for these, while importing dimensions
B. Real-Time Data Is Required
Operational reporting
Systems with high update frequency
Use DirectQuery to relational sources
C. Multiple Data Sources Must Be Combined
Relational databases
OneLake & Delta
Cloud services (e.g., Synapse, SQL DB, Spark)
On-prem gateways
Composite models let you combine these seamlessly.
D. Different Performance vs Freshness Needs
Import for static master data
DirectQuery or Direct Lake for dynamic fact data
Composite vs Pure Models
Aspect
Import Only
Composite
Performance
Very fast
Depends on source/query pattern
Freshness
Scheduled refresh
Real-time/near-real-time possible
Source diversity
Limited
Multiple heterogeneous sources
Model complexity
Simpler
Higher
Query Execution and Optimization
Query Folding
DirectQuery and Power Query transformations rely on query folding to push logic back to the source
Query folding is essential for performance in composite models
Storage Mode Selection
Good modeling practices for composite models include:
Import small dimension tables
Direct Lake for large storage in OneLake
DirectQuery for real-time relational sources
Use aggregations to optimize performance
Modeling Considerations
1. Relationship Direction
Prefer single-direction relationships
Use bidirectional filtering only when required (careful with ambiguity)
2. Data Type Consistency
Ensure fields used in joins have matching data types
In composite models, mismatches can cause query fallbacks
3. Cardinality
High cardinality DirectQuery columns can slow queries
Use star schema patterns
4. Security
Row-level security crosses modes but must be carefully tested
Security logic must consider where filters are applied
Common Exam Scenarios
Exam questions may ask you to:
Choose between Import, DirectQuery, Direct Lake and composite
Assess performance vs freshness requirements
Determine query folding feasibility
Identify correct relationship patterns across modes
Example prompt:
“Your model combines a large OneLake dataset and a small dimension table. Users need current data daily but also fast filtering. Which storage and modeling approach is best?”
Correct exam choices often point to composite models using Direct Lake + imported dimensions.
Best Practices
Define a clear star schema even in composite models
Import dimension tables where reasonable
Use aggregations to improve performance for heavy visuals
Limit direct many-to-many relationships
Use calculation groups to apply analytics consistently
Test query performance across storage modes
Exam-Ready Summary/Tips
Composite models enable flexible and scalable semantic models by mixing storage modes:
Import – best performance for static or moderate data
DirectQuery – real-time access to source systems
Direct Lake – scalable querying of OneLake Delta data
Live Connection – federated or shared datasets
Design composite models to balance performance, freshness, and data volume, using strong schema design and query optimization.
For DP-600, always evaluate:
Data volume
Freshness requirements
Performance expectations
Source location (OneLake vs relational)
Composite models are frequently the correct answer when these requirements conflict.
Practice Questions:
Here are 10 questions to test and help solidify your learning and knowledge. As you review these and other questions in your preparation, make sure to …
Identifying and understand why an option is correct (or incorrect) — not just which one
Look for and understand the usage scenario of keywords in exam questions to guide you
Expect scenario-based questions rather than direct definitions
1. What is the primary purpose of using a composite model in Microsoft Fabric?
A. To enable row-level security across workspaces B. To combine multiple storage modes and data sources in one semantic model C. To replace DirectQuery with Import mode D. To enforce star schema design automatically
✅ Correct Answer: B
Explanation: Composite models allow you to mix Import, DirectQuery, Direct Lake, and Live connections within a single semantic model, enabling flexible performance and data-freshness tradeoffs.
2. You are designing a semantic model with a very large fact table stored in OneLake and small dimension tables. Which storage mode combination is most appropriate?
A. Import all tables B. DirectQuery for all tables C. Direct Lake for the fact table and Import for dimension tables D. Live connection for the fact table and Import for dimensions
✅ Correct Answer: C
Explanation: Direct Lake is optimized for querying large Delta tables in OneLake, while importing small dimension tables improves performance for filtering and joins.
3. Which storage mode allows querying OneLake Delta tables without importing data into memory?
A. Import B. DirectQuery C. Direct Lake D. Live Connection
✅ Correct Answer: C
Explanation: Direct Lake queries Delta tables directly in OneLake, combining scalability with better interactive performance than traditional DirectQuery.
4. What happens when a DAX query in a composite model references both imported and DirectQuery tables?
A. The query fails B. The data must be fully imported C. The engine generates a hybrid query plan D. All tables are treated as DirectQuery
✅ Correct Answer: C
Explanation: Power BI’s engine generates a hybrid query plan, pushing operations to the source where possible and combining results with in-memory data.
5. Which scenario most strongly justifies using a composite model instead of Import mode only?
A. All data fits in memory and refreshes nightly B. The dataset is static and small C. Users require near-real-time data from a large relational source D. The model contains only calculated tables
✅ Correct Answer: C
Explanation: Composite models are ideal when real-time or near-real-time access is needed, especially for large datasets that are impractical to import.
6. In a composite model, which table type is typically best suited for Import mode?
A. High-volume transactional fact tables B. Streaming event tables C. Dimension tables with low cardinality D. Tables requiring second-by-second freshness
✅ Correct Answer: C
Explanation: Importing dimension tables improves query performance and reduces load on source systems due to their relatively small size and low volatility.
7. How do aggregation tables improve performance in composite models?
A. By replacing DirectQuery with Import B. By pre-summarizing data to satisfy queries without scanning detail tables C. By eliminating the need for relationships D. By enabling bidirectional filtering automatically
✅ Correct Answer: B
Explanation: Aggregations allow Power BI to answer queries using pre-summarized Import tables, avoiding expensive queries against large DirectQuery or Direct Lake fact tables.
8. Which modeling pattern is strongly recommended when designing composite models?
A. Snowflake schema B. Flat tables C. Star schema D. Many-to-many relationships
✅ Correct Answer: C
Explanation: A star schema simplifies relationships, improves performance, and reduces ambiguity—especially important in composite and cross-storage-mode models.
9. What is a potential risk of excessive bidirectional relationships in composite models?
A. Reduced data freshness B. Increased memory consumption C. Ambiguous filter paths and unpredictable query behavior D. Loss of row-level security
✅ Correct Answer: C
Explanation: Bidirectional relationships can introduce ambiguity, cause unexpected filtering, and negatively affect query performance—risks that are amplified in composite models.
10. Which feature allows a composite model to reuse an enterprise semantic model while extending it with additional data?
A. Direct Lake B. Import mode C. Live connection with local tables D. Calculation groups
✅ Correct Answer: C
Explanation: A live connection with local tables enables extending a shared enterprise semantic model by adding new tables and measures, forming a composite model.
This post is a part of the DP-600: Implementing Analytics Solutions Using Microsoft Fabric Exam Prep Hub; and this topic falls under these sections:
Implement and manage semantic models (25-30%)
    --> Design and build semantic models
        --> Identify use cases for and configure large semantic model storage format
Overview
As datasets grow in size and complexity, standard semantic model storage can become a limiting factor. Microsoft Fabric (via Power BI semantic models) provides a Large Semantic Model storage format designed to support very large datasets, higher cardinality columns, and more demanding analytical workloads.
For the DP-600 exam, you are expected to understand when to use large semantic models, what trade-offs they introduce, and how to configure them correctly.
What Is the Large Semantic Model Storage Format?
The Large semantic model option changes how data is stored and managed internally by the VertiPaq engine to support:
Larger data volumes (beyond typical in-memory limits)
Higher column cardinality
Improved scalability for enterprise workloads
This setting is especially relevant in Fabric Lakehouse and Warehouse-backed semantic models where data size can grow rapidly.
Key Characteristics
Designed for enterprise-scale models
Supports very large tables and partitions
Optimized for memory management, not raw speed
Works best with Import mode or Direct Lake
Requires Premium capacity or Fabric capacity
Common Use Cases
1. Very Large Fact Tables
Use large semantic models when:
Fact tables contain hundreds of millions or billions of rows
Historical data is retained for many years
Aggregations alone are not sufficient
2. High-Cardinality Columns
Ideal when models include:
Transaction IDs
GUIDs
Timestamps at high granularity
User or device identifiers
Standard storage can struggle with memory pressure in these scenarios.
3. Enterprise-Wide Shared Semantic Models
Useful for:
Centralized datasets reused across many reports
Models serving hundreds or thousands of users
Organization-wide KPIs and analytics
4. Complex Models with Many Tables
When your model includes:
Numerous dimension tables
Multiple fact tables
Complex relationships
Large storage format improves stability and scalability.
5. Direct Lake Models Over OneLake
In Microsoft Fabric:
Large semantic models pair well with Direct Lake
Enable querying massive Delta tables without full data import
Reduce duplication of data between OneLake and the model
When NOT to Use Large Semantic Models
Avoid using large semantic models when:
The dataset is small or moderate in size
Performance is more critical than scalability
The model is used by a limited number of users
You rely heavily on fast interactive slicing
For smaller models, standard storage often provides better query performance.
Performance Trade-Offs
Aspect
Standard Storage
Large Storage
Memory efficiency
Moderate
High
Query speed
Faster
Slightly slower
Max model size
Limited
Much larger
Cardinality tolerance
Lower
Higher
Enterprise scalability
Limited
High
Exam Tip: Large semantic models favor scalability over speed.
How to Configure Large Semantic Model Storage Format
Prerequisites
Fabric capacity or Power BI Premium
Import or Direct Lake storage mode
Dataset ownership permissions
Configuration Steps
Open Power BI Desktop
Go to Model view
Select the semantic model
In Model properties, locate Large dataset storage
Enable the option
Publish the model to Fabric or Power BI Service
Once enabled, the setting cannot be reverted back to standard storage.
Important Configuration Considerations
Enable before model grows significantly
Combine with:
Partitioning
Aggregation tables
Proper star schema design
Monitor memory usage in capacity metrics
Plan refresh strategies carefully
Relationship to DP-600 Exam Topics
This section connects directly with:
Storage mode selection
Semantic model scalability
Direct Lake and OneLake integration
Enterprise model design decisions
Expect scenario-based questions asking you to choose the appropriate storage format based on:
Data volume
Cardinality
Performance requirements
Capacity constraints
Key Takeaways for the Exam
Large semantic models support very large, complex datasets
Use large semantic models for scale, not speed
Best for enterprise-scale analytics
Ideal for high-cardinality, high-volume, enterprise models
Trade performance for scalability
Require Premium or Fabric capacity
One-way configuration—so, plan ahead
Often paired/combined with Direct Lake
Practice Questions:
Here are 10 questions to test and help solidify your learning and knowledge. As you review these and other questions in your preparation, make sure to …
Identifying and understand why an option is correct (or incorrect) — not just which one
Look for and understand the usage scenario of keywords in exam questions to guide you
Expect scenario-based questions rather than direct definitions
1. When should you enable the large semantic model storage format?
A. When the model is used by a small number of users B. When the dataset contains very large fact tables and high-cardinality columns C. When query performance must be maximized for small datasets D. When using Import mode with small dimension tables
Correct Answer: B
Explanation: Large semantic models are designed to handle very large datasets and high-cardinality columns. Small or simple models do not benefit and may experience reduced performance.
2. Which storage modes support large semantic model storage format?
A. DirectQuery only B. Import and Direct Lake C. Live connection only D. All Power BI storage modes
Correct Answer: B
Explanation: Large semantic model storage format is supported with Import and Direct Lake modes. It is not applicable to Live connections or DirectQuery-only scenarios.
3. What is a primary trade-off when using large semantic model storage format?
A. Increased query speed B. Reduced memory usage with no downsides C. Slightly slower query performance in exchange for scalability D. Loss of DAX functionality
Correct Answer: C
Explanation: Large semantic models favor scalability and memory efficiency over raw query speed, which can be slightly slower compared to standard storage.
4. Which scenario is the best candidate for a large semantic model?
A. A departmental sales report with 1 million rows B. A personal Power BI report with static data C. An enterprise model with billions of transaction records D. A DirectQuery model against a SQL database
Correct Answer: C
Explanation: Large semantic models are ideal for enterprise-scale datasets with very large row counts and complex analytics needs.
5. What happens after enabling large semantic model storage format?
A. It can be disabled at any time B. The model automatically switches to DirectQuery C. The setting cannot be reverted D. Aggregation tables are created automatically
Correct Answer: C
Explanation: Once enabled, large semantic model storage format cannot be turned off, making early planning important.
6. Which capacity requirement applies to large semantic models?
A. Power BI Free B. Power BI Pro C. Power BI Premium or Microsoft Fabric capacity D. Any capacity type
Correct Answer: C
Explanation: Large semantic models require Premium capacity or Fabric capacity due to their increased resource demands.
7. Why are high-cardinality columns a concern in standard semantic models?
A. They prevent relationships from being created B. They increase memory usage and reduce compression efficiency C. They disable aggregations D. They are unsupported in Power BI
Correct Answer: B
Explanation: High-cardinality columns reduce VertiPaq compression efficiency, increasing memory pressure—one reason to use large semantic model storage.
8. Which Fabric feature commonly pairs with large semantic models for massive datasets?
A. Power Query Dataflows B. DirectQuery C. Direct Lake over OneLake D. Live connection to Excel
Correct Answer: C
Explanation: Large semantic models pair well with Direct Lake, allowing efficient querying of large Delta tables stored in OneLake.
9. Which statement best describes large semantic model performance?
A. Always faster than standard storage B. Optimized for small, interactive datasets C. Optimized for scalability and memory efficiency D. Not compatible with DAX calculations
Correct Answer: C
Explanation: Large semantic models prioritize scalability and efficient memory management, not maximum query speed.
10. Which design practice should accompany large semantic models?
A. Flat denormalized tables only B. Star schema, aggregations, and partitioning C. Avoid relationships entirely D. Disable incremental refresh
Correct Answer: B
Explanation: Best practices such as star schema design, aggregation tables, and partitioning are critical for maintaining performance and manageability in large semantic models.
This post is a part of the DP-600: Implementing Analytics Solutions Using Microsoft Fabric Exam Prep Hub; and this topic falls under these sections:
Implement and manage semantic models (25-30%)
    --> Design and build semantic models
        --> Implement Calculation Groups, Dynamic Format Strings,
            and Field Parameters
This topic evaluates your ability to design flexible, scalable, and user-friendly semantic models by reducing measure sprawl, improving report interactivity, and standardizing calculations. These techniques are especially important in enterprise-scale Fabric semantic models.
1. Calculation Groups
What Are Calculation Groups?
Calculation groups allow you to apply a single calculation logic to multiple measures without duplicating DAX. Instead of creating many similar measures (e.g., YTD Sales, YTD Profit, YTD Margin), you define the logic once and apply it dynamically.
Calculation groups are implemented in:
Power BI Desktop (Model view)
Tabular Editor (recommended for advanced scenarios)
Common Use Cases
Time intelligence (YTD, MTD, QTD, Prior Year)
Currency conversion
Scenario analysis (Actual vs Budget vs Forecast)
Mathematical transformations (e.g., % of total)
Key Concepts
Calculation Item: A single transformation (e.g., YTD)
SELECTEDMEASURE(): References the currently evaluated measure
Precedence: Controls evaluation order when multiple calculation groups exist
Switching between time granularity (Year, Quarter, Month)
Reducing report clutter while increasing flexibility
How They Work
Field parameters:
Generate a hidden table
Are used in slicers
Dynamically change the field used in visuals
Example
A single bar chart can switch between:
Sales Amount
Profit
Profit Margin
Based on the slicer selection.
Exam Tips
Field parameters are report-layer features, not DAX logic
They do not affect data storage or model size
Often paired with calculation groups for advanced analytics
4. How These Features Work Together
In real-world Fabric semantic models, these three features are often combined:
Feature
Purpose
Calculation Groups
Apply reusable logic
Dynamic Format Strings
Ensure correct formatting
Field Parameters
Enable user-driven analysis
Example Scenario
A report allows users to:
Select a metric (field parameter)
Apply time intelligence (calculation group)
Automatically display correct formatting (dynamic format string)
This design is highly efficient, scalable, and exam-relevant.
Key Exam Takeaways
Calculation groups reduce measure duplication; Calculation groups = reuse logic
SELECTEDMEASURE() is central to calculation groups
Dynamic format strings affect display, not values; Dynamic format strings = display control
Field parameters increase report interactivity; Field parameters = user-driven interactivity
These features are commonly tested together
Practice Questions:
Here are 10 questions to test and help solidify your learning and knowledge. As you review these and other questions in your preparation, make sure to …
Identifying and understand why an option is correct (or incorrect) — not just which one
Look for and understand the usage scenario of keywords in exam questions to guide you
Expect scenario-based questions rather than direct definitions
Question 1
What is the primary benefit of using calculation groups in a semantic model?
A. They improve data refresh performance B. They reduce the number of fact tables C. They allow reusable calculations to be applied to multiple measures D. They automatically optimize DAX queries
Correct Answer: C
Explanation: Calculation groups let you define a calculation once (for example, YTD) and apply it to many measures using SELECTEDMEASURE(), reducing measure duplication and improving maintainability.
Question 2
Which DAX function is essential when defining a calculation item in a calculation group?
A. CALCULATE() B. SELECTEDVALUE() C. SELECTEDMEASURE() D. VALUES()
Correct Answer: C
Explanation: SELECTEDMEASURE() dynamically references the measure currently being evaluated, which is fundamental to how calculation groups work.
Question 3
Where can calculation groups be created?
A. Power BI Service only B. Power BI Desktop Model view or Tabular Editor C. Power Query Editor D. SQL endpoint in Fabric
Correct Answer: B
Explanation: Calculation groups are created in Power BI Desktop (Model view) or using external tools like Tabular Editor. They cannot be created in the Power BI Service.
Question 4
What happens if two calculation groups affect the same measure?
A. The measure fails to evaluate B. The calculation group with the highest precedence is applied first C. Both calculations are ignored D. The calculation group created most recently is applied
Correct Answer: B
Explanation: Calculation group precedence determines the order of evaluation when multiple calculation groups apply to the same measure.
Question 5
What is the purpose of dynamic format strings?
A. To change the data type of a column B. To modify measure values at query time C. To change how values are displayed based on context D. To improve query performance
Correct Answer: C
Explanation: Dynamic format strings control how a measure is displayed (currency, percentage, decimals) without changing the underlying numeric value.
Question 6
Which statement about dynamic format strings is TRUE?
A. They change the stored data in the model B. They require Power Query transformations C. They can be driven by calculation group selections D. They only apply to calculated columns
Correct Answer: C
Explanation: Dynamic format strings are often used alongside calculation groups to ensure values are formatted correctly depending on the applied calculation.
Question 7
What problem do field parameters primarily solve?
A. Reducing model size B. Improving data refresh speed C. Allowing users to switch fields in visuals dynamically D. Enforcing row-level security
Correct Answer: C
Explanation: Field parameters enable report consumers to dynamically change measures or dimensions in visuals using slicers, improving report flexibility.
Question 8
When you create a field parameter in Power BI Desktop, what is generated automatically?
A. A calculated column B. A hidden parameter table C. A new measure D. A new semantic model
Correct Answer: B
Explanation: Power BI creates a hidden table that contains the selectable fields used by the field parameter slicer.
Question 9
Which feature is considered a report-layer feature rather than a modeling or DAX feature?
A. Calculation groups B. Dynamic format strings C. Field parameters D. Measures using iterators
Correct Answer: C
Explanation: Field parameters are primarily a report authoring feature that affects visuals and slicers, not the underlying model logic.
Question 10
Which combination provides the most scalable and flexible semantic model design?
A. Calculated columns and filters B. Multiple duplicated measures C. Calculation groups, dynamic format strings, and field parameters D. Import mode and DirectQuery
Correct Answer: C
Explanation: Using calculation groups for reusable logic, dynamic format strings for display control, and field parameters for interactivity creates scalable, maintainable, and user-friendly semantic models.
This post is a part of the DP-600: Implementing Analytics Solutions Using Microsoft Fabric Exam Prep Hub; and this topic falls under these sections:
Implement and manage semantic models (25-30%)
    --> Design and build semantic models
        --> Write calculations that use DAX variables and functions, such as
            iterators, table filtering, windowing, and information functions
Why This Topic Matters for DP-600
DAX (Data Analysis Expressions) is the core language used to define business logic in Power BI and Fabric semantic models. The DP-600 exam emphasizes not just basic aggregation, but the ability to:
Write readable, efficient, and maintainable measures
Control filter context and row context
Use advanced DAX patterns for real-world analytics
Understanding variables, iterators, table filtering, windowing, and information functions is essential for building performant and correct semantic models.
Using DAX Variables (VAR)
What Are DAX Variables?
DAX variables allow you to:
Store intermediate results
Avoid repeating calculations
Improve readability and performance
Syntax
VAR VariableName = Expression
RETURN FinalExpression
Example
Total Sales (High Value) =
VAR Threshold = 100000
VAR TotalSales = SUM(FactSales[SalesAmount])
RETURN
IF(TotalSales > Threshold, TotalSales, BLANK())
Benefits of Variables
Evaluated once per filter context
Improve performance
Make complex logic easier to debug
Exam Tip: Expect questions asking why variables are preferred over repeated expressions.
Iterator Functions
What Are Iterators?
Iterators evaluate an expression row by row over a table, then aggregate the results.
Common Iterators
Function
Purpose
SUMX
Row-by-row sum
AVERAGEX
Row-by-row average
COUNTX
Row-by-row count
MINX / MAXX
Row-by-row min/max
Example
Total Line Sales =
SUMX(
    FactSales,
    FactSales[Quantity] * FactSales[UnitPrice]
)
Key Concept
Iterators create row context
Often combined with CALCULATE and FILTER
Table Filtering Functions
FILTER
Returns a table filtered by a condition.
High Value Sales =
CALCULATE(
    SUM(FactSales[SalesAmount]),
    FILTER(
        FactSales,
        FactSales[SalesAmount] > 1000
    )
)
Related Functions
Function
Purpose
FILTER
Row-level filtering
ALL
Remove filters
ALLEXCEPT
Remove filters except specified columns
VALUES
Distinct values in current context
Exam Tip: Understand how FILTER interacts with CALCULATE and filter context.
Windowing Functions
Windowing functions enable calculations over ordered sets of rows, often used for time intelligence and ranking.
Exam Note: Windowing functions are increasingly emphasized in modern DAX patterns.
Information Functions
Information functions return metadata or context information rather than numeric aggregations.
Common Information Functions
Function
Purpose
ISFILTERED
Detects column filtering
HASONEVALUE
Checks if a single value exists
SELECTEDVALUE
Returns value if single selection
ISBLANK
Checks for blank results
Example
Selected Year =
IF(
    HASONEVALUE(DimDate[Year]),
    SELECTEDVALUE(DimDate[Year]),
    "Multiple Years"
)
Use Cases
Dynamic titles
Conditional logic in measures
Debugging filter context
Combining These Concepts
Real-world DAX often combines multiple techniques:
Average Monthly Sales =
VAR MonthlySales =
    SUMX(
        VALUES(DimDate[Month]),
        [Total Sales]
    )
RETURN
AVERAGEX(
    VALUES(DimDate[Month]),
    MonthlySales
)
This example uses:
Variables
Iterators
Table functions
Filter context awareness
Performance Considerations
Prefer variables over repeated expressions
Minimize complex iterators over large fact tables
Use star schemas to simplify DAX
Avoid unnecessary row context when simple aggregation works
Common Exam Scenarios
You may be asked to:
Identify the correct use of SUM vs SUMX
Choose when to use FILTER vs CALCULATE
Interpret the effect of variables on evaluation
Diagnose incorrect ranking or aggregation results
Correct answers typically emphasize:
Clear filter context
Efficient evaluation
Readable and maintainable DAX
Best Practices Summary
Use VAR / RETURN for complex logic
Use iterators only when needed
Control filter context explicitly
Leverage information functions for conditional logic
Test measures under multiple filter scenarios
Quick Exam Tips
VAR / RETURN = clarity + performance
SUMX ≠ SUM (row-by-row vs column aggregation)
CALCULATE = filter context control
RANKX / WINDOW = ordered analytics
SELECTEDVALUE = safe single-selection logic
Summary
Advanced DAX calculations are foundational to effective semantic models in Microsoft Fabric:
Variables improve clarity and performance
Iterators enable row-level logic
Table filtering controls context precisely
Windowing functions support advanced analytics
Information functions make models dynamic and robust
Mastering these patterns is essential for both real-world analytics and DP-600 exam success.
Practice Questions:
Here are 10 questions to test and help solidify your learning and knowledge. As you review these and other questions in your preparation, make sure to …
Identifying and understand why an option is correct (or incorrect) — not just which one
Look for and understand the usage scenario of keywords in exam questions to guide you
Expect scenario-based questions rather than direct definitions
1. What is the primary benefit of using DAX variables (VAR)?
A. They change row context to filter context B. They improve readability and reduce repeated calculations C. They enable bidirectional filtering D. They create calculated columns dynamically
Correct Answer: B
Explanation: Variables store intermediate results that are evaluated once per filter context, improving performance and readability.
2. Which function should you use to perform row-by-row calculations before aggregation?
A. SUM B. CALCULATE C. SUMX D. VALUES
Correct Answer: C
Explanation: SUMX is an iterator that evaluates an expression row by row before summing the results.
3. Which statement best describes the FILTER function?
A. It modifies filter context without returning a table B. It returns a table filtered by a logical expression C. It aggregates values across rows D. It converts row context into filter context
Correct Answer: B
Explanation: FILTER returns a table and is commonly used inside CALCULATE to apply row-level conditions.
4. What happens when CALCULATE is used in a measure?
A. It creates a new row context B. It permanently changes relationships C. It modifies the filter context D. It evaluates expressions only once
Correct Answer: C
Explanation: CALCULATE evaluates an expression under a modified filter context and is central to most advanced DAX logic.
5. Which function is most appropriate for ranking values in a table?
A. COUNTX B. WINDOW C. RANKX D. OFFSET
Correct Answer: C
Explanation: RANKX assigns a ranking to each row based on an expression evaluated over a table.
6. What is a common use case for windowing functions such as OFFSET or WINDOW?
A. Creating relationships B. Detecting blank values C. Calculating running totals or moving averages D. Removing duplicate rows
Correct Answer: C
Explanation: Windowing functions operate over ordered sets of rows, making them ideal for time-based analytics.
7. Which information function returns a value only when exactly one value is selected?
A. HASONEVALUE B. ISFILTERED C. SELECTEDVALUE D. VALUES
Correct Answer: C
Explanation: SELECTEDVALUE returns the value when a single value exists in context; otherwise, it returns blank or a default.
8. When should you prefer SUM over SUMX?
A. When calculating expressions row by row B. When multiplying columns C. When aggregating a single numeric column D. When filter context must be modified
Correct Answer: C
Explanation: SUM is more efficient when simply adding values from one column without row-level logic.
9. Why can excessive use of iterators negatively impact performance?
A. They ignore filter context B. They force bidirectional filtering C. They evaluate expressions row by row D. They prevent column compression
Correct Answer: C
Explanation: Iterators process each row individually, which can be expensive on large fact tables.
10. Which combination of DAX concepts is commonly used to build advanced, maintainable measures?
A. Variables and relationships B. Iterators and calculated columns C. Variables, CALCULATE, and table functions D. Information functions and bidirectional filters
Correct Answer: C
Explanation: Advanced DAX patterns typically combine variables, CALCULATE, and table functions for clarity and performance.
Information and resources for the data professionals' community