Category: Business Intelligence Platform

Why I am excited about using Microsoft Power BI

Our team at work recently started using the Power BI platform. We are just getting going but I am already loving this tool. Our current enterprise BI platforms are Qlik and OBI (Oracle Business Intelligence), however, Power BI has has gained significant traction in business teams over the last couple years where it used for departmental reporting and analysis.

I see why the business teams love this tool and am excited about bringing it into our portfolio of tools for delivering analytic solutions across the company. These are some of the reasons I like Power BI:

  • First and foremost, we have not yet come across anything that we currently do in Qlik or OBI that we will not be able to do in Power BI. This was very important.

Power BI has a very intuitive and well laid out interface. You can easily switch between the visualizations, the data, and the data model. And within each of those tabs, you easily navigate using the well-placed objects and menu items. I found the interface easy to get accustomed to.

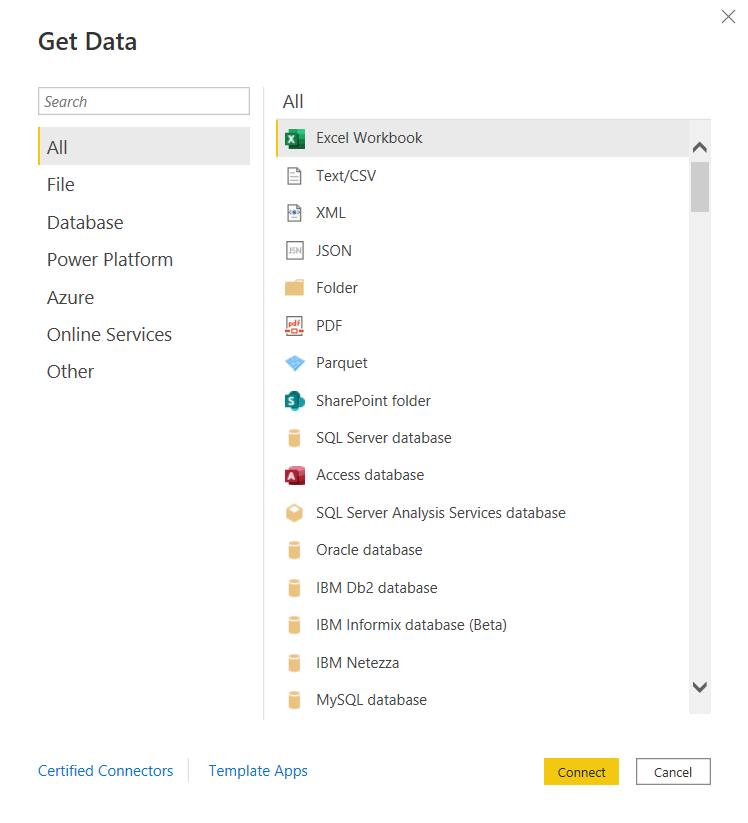
  • You can connect to just about any data source. The list is long. It seems the only source missing is an alien database on Mars. 🙂 I am kidding, but I did not find a native connector for Informix – the most uncommon database that we currently have as a source, but of course, ODBC and JDBC are available for those scenarios. Take a look.

and there are many more!

Some notable connectors are SQL Server Analysis Services, PostgreSQL, Amazon Redshift, Google BigQuery, Snowflake, various Azure data sources, Salesforce, Spark, GitHub, Databricks, and many more.

  • There are many awesome features for handling Excel data. And although we try to avoid Excel data as a source, it’s just not possible at times, and sometimes it makes sense to use those sources. However, the Power Query functionality allows users to perform ETL tasks on any data from any source.
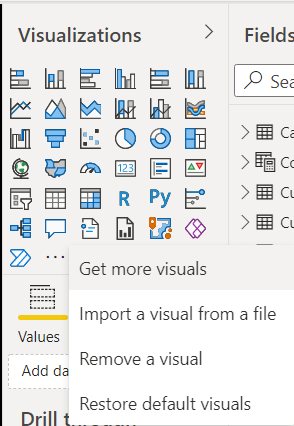
  • Power BI has many built-in visualization options.

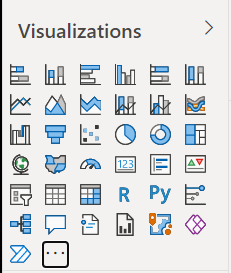
And you have the ability to “get more” from the marketplace.

  • Data modeling in Power BI is based on a methodology that our team is very familiar with: Dimensional Modeling, also known as, Star-Schema Modeling. And this is a proven method that works for efficient analytic solutions. In Power BI, it is also easy to create relationships between tables, change data types, and build hierarchies.
  • Within the data models, you can also use a versatile language called DAX (Data Analysis Expressions) to manipulate data, filter data, build measures, and more. I find that what’s possible with DAX brings Power BI into a whole other tier of flexibility compared to other tools. There is a bit of a learning curve for DAX, but you can start by focusing on a few key functions, and then expand your knowledge over time.
  • As you would expect in any modern BI platform, the security features in Power BI provide for object-level and data-level security. We have set up some simple security scenarios so far and it was straightforward. We will be digging more into setting up some more complex security scenarios soon and will report on that experience.
  • Data profiling features are built into Power BI, which may save you some time from having to jump into another query tool to profile your data.
  • Along with some standard analytic features, such as TopN, conditional formatting, and aggregate functions, Power BI also offers AI visuals, R and Python visuals, and advanced algorithms (such as key influencers and outliers) are available. I can foresee us using these features in the future.
  • Integration options with Office 365, SharePoint, and Teams.
  • Power BI is a great platform for one of the most significant trends in analytics – that is, users clamoring for Self-Service Analytics. With the ability to easily secure and share Power BI datasets, and users able to easily connect and use that data with an intuitive, optional code, tool that they may already have exposure to, it will be easier to implement self-service solutions. There are also some cool features for report consumers, such as personalization of visuals and mobile view.
  • A company called P3Adaptive delivered an awesome training for us, but there are tons of free resources available for learning. A good place to start is the Power BI lessons on Microsoft Learn – Power BI. And then, sign up for Dashboard in a Day (DIAD), a free one-day instructor-led training. You can find and register for DIAD classes here: Microsoft Events – DIAD
  • There are reasons why the Power BI platform has been at the top of the “Gartner Magic Quadrant for Business Intelligence and Analytics Platforms” for the last 3 years. It has a lot going for it and the company seems to be aggressive about continuous improvement.

I look forward to the Power BI journey and the ongoing quest to make our data as valuable as possible for our company.

External Embedded Content in OBIEE or OAS dashboard pages does not display in most web browsers

There is an “issue” or “security feature” (depending on how you look at it) that exists in OBIEE 12c (Oracle Business Intelligence) and in OAS (Oracle Analytics Server). The OBIEE or OAS dashboard pages do not display external embedded content in most browsers.

We use multiple BI platforms, but wanted to avoid sending users to one platform for some reporting and to another for other reporting. This can be confusing to users. To provide a good user experience by directing users to one place for all dashboards and self-service reporting, we have embedded most of the QlikView and Qlik Sense dashboards into OBI pages. With that, the users can be provided with one consistent training and have one place to go.

However, the Qlik embedded content only shows when using the IE (Internet Explorer) browser and the others give some “error” message.

  • The Chrome browser gives this error message:
    “Request to the server have been blocked by an extension.”
  • And the Edge browser gives this message:
    “This content is blocked. Contact the site owner to fix the issue.”

Or you may get other messages, such as (from Oracle Doc ID: 2273854.1):

  • Internet Explorer
    This content cannot be displayed in a frame
    To help protect the security of information you enter into this website, the publisher of this content does not allow it to be displayed in a frame.
  • Firefox
    No message is displayed on the page, but if you open the browser console (Ctrl+Shift+I) you see this message in it:
    Content Security Policy: The page’s settings blocked the loading of a resource at http://<server>/ (“default-src http://<server&gt;:<port>”).
  • Chrome
    No message is displayed on the page, but if you open the browser console (Ctrl+Shift+I) you see this message in it:
    Refused to frame ‘http://<server>/&#8217; because it violates the following Content Security Policy directive: “default-src ‘self'”. Note that ‘frame-src’ was not explicitly set, so ‘default-src’ is used as a fallback

This situation, although not ideal, has been fine since our company’s browser standard is IE and we provided a work-around for users that use other browsers to access the embedded content. But this will change soon since IE is going away.

There are 2 solutions to address the embedded content issue.

  1. Run Edge browser in IE mode for the BI applications sites/URLs.
    1. This would have been a good option for us, but it causes issues with the way we have SSO configured for a group of applications.
  2. Perform some configuration changes as outline below from Oracle Doc ID: 2273854.1.
    1. We ended up going forward with this solution and our team got it to work after some configurations trial and error.

(from Oracle Doc ID: 2273854.1):

For security reasons, you can no longer embed content from external domains in dashboards. To embed external content in dashboards, you must edit the instanceconfig.xml file. 

To allow the external content:

  1. Make a backup copy of <DOMAIN_HOME>/config/fmwconfig/biconfig/OBIPS/instanceconfig.xml
  2. Edit the <DOMAIN_HOME>/config/fmwconfig/biconfig/OBIPS/instanceconfig.xml file and add the ContentSecurityPolicy element inside the Security element:

<ServerInstance>

<Security>

  <InIFrameRenderingMode>allow</InIFrameRenderingMode>
  <ContentSecurityPolicy>
    <PolicyDirectives>
      <Directive>
        <Name>child-src</Name>
        <Value>’self’ http://www.xxx.com http://www.yyy.com</Value>
      </Directive>
      <Directive>
        <Name>img-src</Name>
        <Value>’self’ http://www.xxx.com http://www.yyy.com</Value>
      </Directive>
    </PolicyDirectives>
  </ContentSecurityPolicy>

</Security>

</ServerInstance>

  1. Restart the presentation server component (obips1)

Engage the teams responsible for enterprise browser settings or other appropriate teams at your company as necessary.

NULL values in prompts after upgrade from OBIEE to OAS

After upgrading from OBIEE to OAS (Oracle Business Intelligence to Oracle Analytics Server), the prompts started showing NULL values in the drop downs. This was not happening in OBI because we had the <ShowNullValueWhenColumnIsNullable> config parameter set to “never” for prompts.

This setting looked something like this in OBIEE (note the first line after the <Prompts> tag):

<ServerInstance>

<Prompts>
<ShowNullValueWhenColumnIsNullable>never</ShowNullValueWhenColumnIsNullable>
<MaxDropDownValues>256</MaxDropDownValues>
<ResultRowLimit>65000</ResultRowLimit>
<AutoApplyDashboardPromptValues>true</AutoApplyDashboardPromptValues>
<AutoSearchPromptDialogBox>true</AutoSearchPromptDialogBox>

</Prompts>

</ServerInstance>

In OAS, this parameter needs to be set in the new analytics/systemsettings page. Go to that page and set the option. Then restart by clicking on the Restart button on that page. After a restart, it resolved the issue for us.

We had a similar resolution to an issue we had with “not able to save analyses that contained HTML markup“.

Unable to save analysis with HTML markup in OAS after upgrade from OBIEE

We recently upgraded from OBIEE 12 to OAS 5.5. (Oracle Business Intelligence to Oracle Analytics Server). After the upgrade, we were not able to save analyses that contained HTML markup. We were able to do this before the upgrade.

Turns out, the configuration parameter for this now needs to be set in the new analytics/systemsettings page. Go to that page and enable the option “Allow HTML Content”. Then restart by clicking on the Restart button on that page.

After a restart, it resolved the issue for us.

If this doesn’t resolve it for you, you may need to remove the parameter from the instance config file and try again.

Back up your instanceconfig.xml file. Then edit it by removing the element “EnableSavingContentWithHTML” from the Security section and save the file. You will be removing a line that looks something like this:

“<EnableSavingContentWithHTML>true</EnableSavingContentWithHTML>”

Then go back to the analytics/systemsettings page, confirm “Allow HTML Content” is enabled, and restart again. This hopefully should resolve your issue.

BI Application getting ORA-02391 error

Last week we rolled out a new dashboard that uses a new data source.
In one of our BI environments, the application was throwing an error:
“ORA-02391: exceeded simultaneous SESSIONS_PER_USER limit at OCI call OCISessionBegin

This is an Oracle Database error, and not an error directly from the BI Application.

For the “ORA-02391: exceeded simultaneous SESSIONS_PER_USER limit” error …
The Cause is:   An attempt was made to exceed the maximum number of concurrent sessions allowed by the SESSIONS_PER_USER clause of the user profile.
And the Action for resolution is:   End one or more concurrent sessions or ask the database administrator to increase the SESSIONS_PER_USER limit of the user profile.

Turns out the SESSIONS_PER_USER parameter was set too low; it was set to 3 for the user being used to access the database from the BI application. This error could have also been observed from an ETL tool accessing the database with an ID with the same parameter setting.

One of the DBAs bumped this parameter up to 30 for the user, and that resolved the issue.
We requested for this change to be done on the BI application databases in all the environments – Development, Test, QA, and Production.

Although all seems to be well, we will now monitor to see how many sessions the application is using and if there is any negative impact on the source application. This will allow us to determine if we need to make any other adjustments.

Thanks for reading. I hope you found this information useful.

BI Application getting ORA-00257 Error

One day this week, we got the following error showing up on our BI dashboards.
“ORA-00257: Archiver error. Connect AS SYSDBA only until resolved.”
This is an Oracle database error (which you may guess based on the “ORA”), and not an error directly from BI application.

If you get this error, it means that the database redo logs are filled up, and cannot be archived due to lack of space on the designated archive area or some other issue. In our case, the “some other issue” was caused by some issues with “commvault”, a software application used for data backup and recovery, among other things.

When this happens, if a user tries to connect to the database, such as the BI Application user in our case, the database will not allow the new connection. The only exception is SYSDBA users will be allowed to connect.

If you are not the database administrator (DBA), you will most likely work with your DBA (as we do) to get this error resolved.
After the issue that caused the problem is resolved and the redo logs are cleared, then the database, and therefore the BI application, will allow new connections as normal.

Thanks for reading and I hope you found this helpful.

Error downloading data to Excel in OBIEE 12c

If you get the error …

“There was an error processing your download. Please check with your administrator.”

… when Exporting / Downloading data from an analysis in OBIEE, then this post might be helpful.

In OBIEE, you have a few options for exporting / downloading data from an analysis / report as shown below. You can export / download to PDF, Excel 2007+, PowerPoint 2007+, Web Archive (.mht), or in CSV, Tab Delimited, or XML data formats.

OBIEE_Export_Analysis_Data

If you are trying to download data from an analysis and get this error …

OBIEE_Export_to_Excel_Failed

“There was an error processing your download. Please check with your administrator.”
then try the following fix. Note, you might find that you are able to download to CSV, but get the error when you try to download to Excel.

Edit the config.xml file
Located at the directory specified below (for OBIEE 12c):
ORACLE_HOME/user_projects/domains/bi/config/fmwconfig/biconfig/OBIJH

FYI, this is the location of the config.xml file in OBIEE 11g
[MW_HOME]/instances/instance1/config/OracleBIJavaHostComponent/coreapplication_obijh1

Locate the section and the parameter within that section. It may look like below, but there could be more or less parameters within the section than shown here.

<XMLP>
<InputStreamLimitInKB>8192</InputStreamLimitInKB>
<ReadRequestBeforeProcessing>true</ReadRequestBeforeProcessing>
</XMLP>

Change the value of the InputStreamLimitInKB parameter to 0 as shown below…

<XMLP>
<InputStreamLimitInKB>0</InputStreamLimitInKB>
<ReadRequestBeforeProcessing>true</ReadRequestBeforeProcessing>
</XMLP>

Restart the OBIEE services and try your export again.

If it succeeds, then we know for sure that altering this parameter fixes it.
Setting the above parameter value to zero (0) means that there is no limit. So, you may now go back and modify the value to a number that is suitable for your environment, such as, 8192, 15384, 65536, etc.

Error on reports after upgrading to OBIEE 12.2.1.1.0 – “nQSError 35029: Unable to evaluate text 0.0 as either true or false”

After upgrading or migrating to OBIEE 12.2.1.1.0, you may encounter this error: “nQSError 35029: Unable to evaluate text 0.0 as either true or false”.
This is a known bug and there is a patch for it.

The Bug # is: 24005980
And the Patch # and description is: 24005980 RPD CONSISTENCY ERRORS AFTER UPGRADE FROM 12.2.1.0.0 TO 12.2.1.1.0.

Applying this patch resolved the issue for us.

Good luck with your resolution.

InfatoODI – Informatica to ODI conversion tool

We are currently in the process of upgrading Oracle Business Intelligence Applications (OBIA) from version 7.9.6 to OBIA 11g.  Oracle has replaced Informatica as the data integration tool in the platform with it’s own tool, Oracle Data Integrator (ODI). This was a selfish, profit-driven move on Oracle’s part with no consideration for the impact on customers, but it is what it is.

Because of this, as a part of the upgrade to the new OBIA release, we need to convert all our hundreds of Informatica mappings to ODI.  As you can imagine, this is a lot of work.  We are getting help from a company that has developed a specialized conversion tool called InfatoODI, which converts Informatica mappings to ODI interfaces.

We are performing the conversions specifically for an OBIA application, but the tool can be used as a straight conversion tool for Informatica-to-ODI for any type of application.

We are in the beginning stages of the project, but early indications are that the tool will save us time, but I am not sure how significant as yet. I will post updates as we progress through the conversions with my experience and opinion of the tool.

When Export to Excel (csv) in OBIEE 12c, rows are limited to 65000 (65K)

After upgrading to OBIEE 12c, you may have noticed that your downloads to Excel CSV files are now getting cut off at 65000 rows.  If you are experiencing this issue, this post may help.

In OBIEE 11g, there was a parameter (instanceconfig.xml parameter) called “DefaultRowsDisplayedInDownload” that controlled the number of rows downloadable to a CSV file.   So, if you had that set to a number higher than 65K, then you would have been able to download more than 65K rows in the past.

However, the parameter that now controls the number of rows downloadable to CSV in OBIEE 12c is “DefaultRowsDisplayedInDownloadCSV“.  You will need to set this parameter in the instanceconfig.xml file based on your needs.

This parameter DefaultRowsDisplayedInDownloadCSV is found within the <Table> section which may look something like this:

<Table>
< DefaultRowsDisplayedInDelivery>1000000</DefaultRowsDisplayedInDelivery>
< DefaultRowsDisplayedInDownload>1000000</DefaultRowsDisplayedInDownload>
< MaxCells>10000000</MaxCells>
< MaxVisiblePages>50</MaxVisiblePages>
< MaxVisibleRows>1000000</MaxVisibleRows>
< MaxVisibleSections>100000</MaxVisibleSections>
< DefaultRowsDisplayed>100</DefaultRowsDisplayed>
<DefaultRowsDisplayedInDownloadCSV>200000</DefaultRowsDisplayedInDownloadCSV>
< /Table>

As always, back up your files before making changes.  Then, change the parameter as needed, and restart OBIEE services.