Category: AI

Choosing the Right Chart to display your data in Power BI or any other analytics tool

Data visualization is at the heart of analytics. Choosing the right chart or visual can make the difference between insights that are clear and actionable, and insights that remain hidden. There are many visualization types available for showcasing your data, and choosing the right ones for your use cases is important. Below, we’ll walk through some common scenarios and share information on the charts best suited for them, and will also touch on some Power BI–specific visuals you should know about.

1. Showing Trends Over Time

When to use: To track how a measure changes over days, months, or years.

Best charts:

  • Line Chart: The classic choice for time series data. Best when you want to show continuous change. In Power BI, the line chart visual can also be used for forecasting trends.
  • Area Chart: Like a line chart but emphasizes volume under the curve—great for cumulative values or when you want to highlight magnitude.
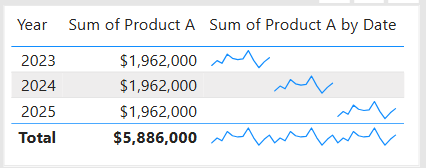
  • Sparklines (Power BI): Miniature line charts embedded in tables or matrices. Ideal for giving quick context without taking up space.

2. Comparing Categories

When to use: To compare values across distinct groups (e.g., sales by region, revenue by product).

Best charts:

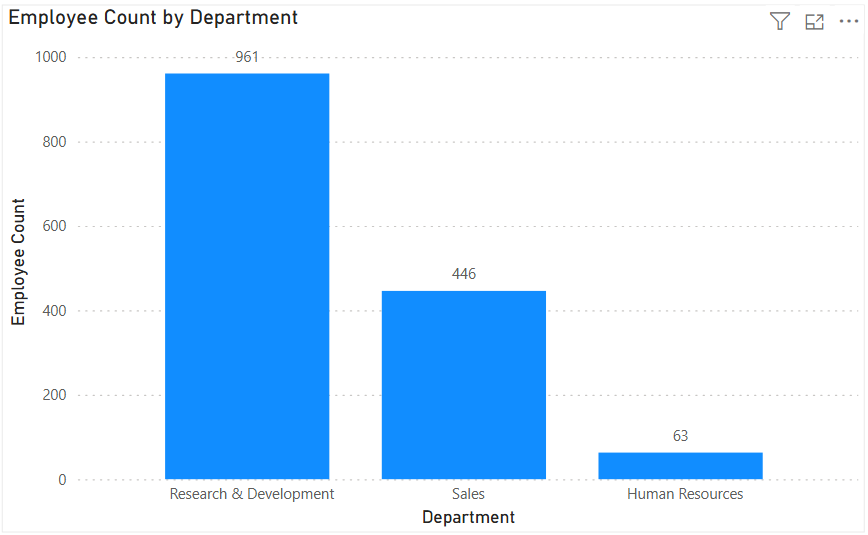
  • Column Chart: Vertical bars for category comparisons. Good when categories are on the horizontal axis.
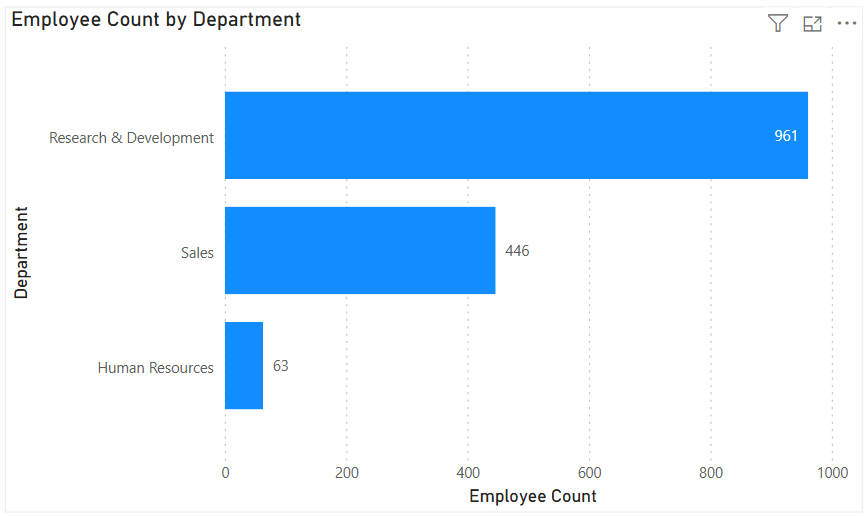
  • Bar Chart: Horizontal bars—useful when category names are long or when ranking items. Is usually a better choice than the column chart when there are many values.
  • Stacked Column/Bar Chart: Show category totals and subcategories in one view. Works for proportional breakdowns, but can get hard to compare across categories.
3. Understanding Relationships

When to use: To see whether two measures are related (e.g., advertising spend vs. sales revenue).

Best charts:

  • Scatter Chart: Plots data points across two axes. Useful for correlation analysis. Add a third variable with bubble size or color to generate more insights. This chart can also be useful for identifying anomalies/outliers in the data.
  • Line & Scatter Combination: Power BI lets you overlay a line for trend direction while keeping the scatter points.
  • Line & Bar/Column Chart Combination: Power BI offers some of these combination charts also to allow you to relate your comparison measures to your trend measures.

4. Highlighting Key Metrics

Sometimes you don’t need a chart—you just want a single number to stand out. These types of visuals are great for high-level executive dashboards, or for the summary page of dashboards in general.

Best visuals in Power BI:

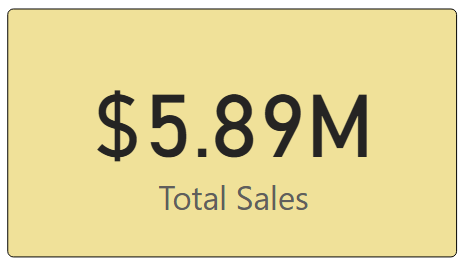
  • Card Visual: Displays one value clearly, like Total Sales.
  • KPI Visual: Adds target context and status indicator (e.g., actual vs. goal).
  • Gauge Visual: Circular representation of progress toward a goal—best for showing percentages or progress to target. For example, Performance Rating score shown on the scale of the goal.
5. Distribution Analysis

When to use: To see how data is spread across categories or ranges.

Best charts:

  • Column/Bar Chart with bins: Useful for creating histograms in Power BI.
  • Box-and-Whisker Chart (custom visual): Shows median, quartiles, and outliers.
  • Pie/Donut Charts: While often overused, they can be effective for showing composition when categories are few (ideally 3–5). For example, show the number and percentage of employees in each department.

6. Spotting Problem Areas

When to use: To identify anomalies or areas needing attention across a large dataset.

Best charts:

  • Heatmap: A table where color intensity represents value magnitude. Excellent for finding hot spots or gaps. This can be implemented in Power BI by using a Matrix visual with conditional formatting in Power BI.
  • Treemap: Breaks data into rectangles sized by value—helpful for hierarchical comparisons and for easily identifying the major components of the whole.

7. Detail-Level Exploration

When to use: To dive into raw data while keeping formatting and hierarchy.

Best visuals:

  • Table: Shows granular row-level data. Best for detail reporting.
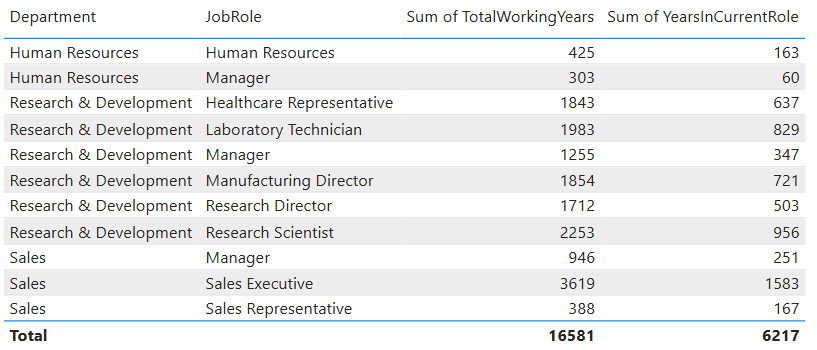
  • Matrix: Adds pivot-table–like functionality with rows, columns, and drill-down. Often combined with conditional formatting and sparklines for added insight.
8. Part-to-Whole Analysis

When to use: To see how individual parts contribute to a total.

Best charts:

  • Stacked Charts: Show both totals and category breakdowns.
  • 100% Stacked Charts: Normalize totals so comparisons are by percentage share.
  • Treemap: Visualizes hierarchical data contributions in space-efficient blocks.

Quick Reference: Which Chart to Use?

ScenarioBest Visuals
Tracking trends, forecasting trendsLine, Area, Sparklines
Comparing categoriesColumn, Bar, Stacked
Showing relationshipsScatter, Line + Scatter, Line + Column/Bar
Highlighting metricsCard, KPI, Gauge
Analyzing distributionsHistogram (columns with bins), Box & Whisker, Pie/Donut (for few categories)
Identifying problem areasHeatmap (Matrix with colors), Treemap, Scatter
Exploring detail dataTable, Matrix
Showing part-to-wholeStacked Column/Bar, 100% Stacked, Treemap, Pie/Donut

The below graphic shows the visualization types available in Power BI. You can also import additional visuals by clicking the “3-dots” (get more visuals) at the bottom of the visualization icons.

Summary

Power BI, and other BI/analytics tools, offers a rich set of visuals, each designed to represent data in a way that suits a specific set of analytical needs. The key is to match the chart type with the story you want the data to tell. Whether you’re showing a simple KPI, uncovering trends, or surfacing problem areas, choosing the right chart ensures your insights are clear, actionable, and impactful. In addition, based on your scenario, it can also be beneficial to get feedback from the user population on what other visuals they might find useful or what other ways they would they like to see the data.

Thanks for reading! And good luck on your data journey!

Workday’s Game-Changing Move: Acquiring Paradox (an AI Recruitment software player)

Workday announced, alongside its Q2 2026 financial results, a definitive agreement to acquire Paradox on August 21, 2025. The acquisition is a strategic move to integrate Paradox’s conversational AI for high-volume candidate experience into Workday’s enterprise platform. As someone that works in the data space, works with Workday, and supports the HR function, this is of interest to me.

Who They Are

Workday
Founded in 2005, Workday is a leading cloud-based enterprise software provider specializing in human capital management (HCM) and financial services. Trusted by over 11,000 organizations—including more than 65% of the Fortune 500—it helps companies manage payroll, recruiting, and more through its AI-first platform. Wikipedia. Workday has been going all in on AI, which is why they were interested in Paradox.

Paradox
Launched in 2016, Paradox is an innovative player in conversational AI for recruitment. Known for its digital assistant Olivia, Paradox streamlines high-volume hiring processes—handling things like screening, scheduling, and candidate Q&A via chat, SMS, or mobile interfaces. It serves clients like McDonald’s, Unilever, and Chipotle and has powered over 189 million candidate interactions, achieving conversion rates above 70% and cutting time-to-hire to as fast as 3.5 days. PR Newswire+1. That is an impressive time-to-hire statistic!

Why This Acquisition Matters

  1. Extends Workday’s Talent Acquisition Suite
    Integrating Paradox lets Workday offer a full-spectrum hiring solution—from AI-based candidate matching via HiredScore to Paradox’s conversational interface and back-office onboarding through Workday Recruiting—all within one seamless platform. IT ProPR NewswireAInvest
  2. Gains Ground in Frontline Hiring
    Frontline roles (think retail, hospitality, logistics) make up a huge swath of global jobs—roughly 70%. Paradox delivers exactly what that market needs: fast, high-volume, scalable hiring. Josh Bersin even called this “a highly strategic move” that could reshape Workday’s growth trajectory. JOSH BERSINHR Tech Feed
  3. Built-In AI Innovation
    Adding Paradox brings not just the tech, but the talent behind its AI tools. This deepens Workday’s AI capabilities and supports its long-term vision of building an AI agent-centric architecture. JOSH BERSINAInvest
  4. Proven ROI on Day One
    Paradox has delivered significant outcomes—Chipotle saw a 75% reduction in time-to-hire and doubled candidate flow; other clients report streamlined scheduling and improved candidate experience. PR Newswire+1HR Executive

What’s in It for Workday—and how it changes the HR Tech Landscape

For Workday:

  • Expands its offering to include a strong solution for frontline and contingent workers, not just white-collar roles.
  • Enhances AI-driven hiring tools—turning a fragmented process into a unified, intelligent workflow.
  • Likely to drive stronger customer loyalty and cross-sell opportunities.
  • Will immediately add to Workday’s bottomline.

For the broader HR applications market:

  • Sets a higher bar for talent acquisition platforms—more emphasis on candidate experience, AI-driven efficiency, and conversational interfaces.
  • Adds pressure on competitors like Oracle, SAP, and ADP to step up their AI and frontline hiring solutions. ReutersInvesting.com

Final Thoughts

Workday’s acquisition of Paradox isn’t just about buying another tool—it’s a strategic leap into a broader, more intelligent, and more conversational hiring experience for a wider swath of the workforce. With the deal expected to close in Q3 of its fiscal year 2026 (ending October 31, 2025), Workday is positioning itself as a go-to AI-powered talent platform—built for the volume and complexity of today’s global labor markets.

Thanks for reading!

AI in the Hospitality Industry: Transforming Guest Experiences and Operations

Artificial Intelligence (AI) is reshaping the hospitality industry from guest-facing interactions to back-office optimization and revolutionizing guest experiences and operational efficiency. As hotels, resorts, and travel companies compete in an increasingly digital-first world, AI has become more than just a buzz – despite its challenges and failures – it is a strategic necessity. AI in hospitality is expected to grow 60% per year over the next decade (from 2023 to 2033), going from $90M in 2023 to $8B in 2033. In this article, I will share how AI is being used in hospitality and the benefits being derived or expected from those solutions. I will also touch on some of the challenges. This article is the first of a series that cover AI in various industries and business functions.

How AI Is Being Used in Hospitality

AI applications in hospitality span both guest-facing and operational functions. Examples include:

  • Chatbots and Virtual Assistants: This is one of the most highly used AI tools in hospitality. Many hotel chains use AI-powered chatbots (such as Hilton’s “Connie,” powered by IBM Watson) to handle booking requests, answer FAQs, and provide concierge services.
  • Personalized Marketing and Recommendations: Platforms like Booking.com and Airbnb use AI algorithms to recommend accommodations, activities, and promotions tailored to guests’ preferences.
  • Automated Check-ins: Hotels are rolling out solutions that allow for automated/mobile guest check-ins, sometimes with facial recognition, and digital room keys.
  • Dynamic Pricing: Revenue management systems leverage AI to adjust room rates in real time, based on demand, competition, and historical data.
  • Voice-Controlled Rooms: Smart assistants (Alexa for Hospitality, Google Nest Hub) allow guests to control lighting, temperature, and entertainment hands-free.
  • Predictive Maintenance: AI monitors hotel equipment (elevators, HVAC, kitchen appliances) to predict and prevent failures before they disrupt service.
  • Facial Recognition: Some hotels in Asia use AI-powered check-in systems that identify guests quickly and securely, reducing wait times.
  • Staff Scheduling: AI platforms are being used to optimize staffing across teams and sometimes locations, to allow companies to do more with less people while improving guests’ experiences.

Tools, Technologies, and Methods Behind AI in Hospitality

The AI ecosystem in hospitality is powered by several key technologies and platforms. Here are just a few examples:

  • Machine Learning (ML) for demand forecasting, dynamic pricing, and guest behavior prediction.
  • Natural Language Processing (NLP) for chatbots, voice assistants, and multilingual guest support.
  • Computer Vision for facial recognition check-ins and enhanced security.
  • Robotics for room service delivery (e.g., robot butlers in select Marriott and Yotel properties).
  • Cloud-Based Platforms like Microsoft Azure AI, AWS AI Services, and Google Cloud AI for scalable data processing.
  • AI-Powered CRMs (e.g., Salesforce Einstein, Zoho Zia) for personalized marketing campaigns and guest engagement.

Benefits of AI in Hospitality

Companies that have adopted AI report significant improvements. Some of the known benefits include, but are not limited to:

  • Enhanced Customer Service: 24/7 chatbots provide support and answer guests’ questions instantly. Also, surveys have indicated that a high percentage of guests are comfortable with automated front desks/self-check-ins, indicating their readiness for AI powered guest services.
  • Enhanced Guest Experiences: AI-driven personalization leads to higher satisfaction and loyalty.
  • Operational Efficiency: Predictive analytics and automation reduce costs by optimizing staffing, inventory, and maintenance.
  • Revenue Growth and Management: Dynamic pricing algorithms increase occupancy rates and maximize revenue per available room (RevPAR).
  • Cost Management/Reduction: Through AI Assisted solutions like smart building and equipment systems, staffing optimization, automated supply chain, food management systems, and more, hospitality companies can significantly reduce costs.
  • 24/7 Availability: Chatbots and virtual assistants ensure guests receive support around the clock without adding staffing overhead.

Pitfalls and Challenges of AI in Hospitality

Despite its promise, AI adoption is not without hurdles. In addition to technology or tool challenges, there are also people challenges that impact the implementation and adoption of AI tools. Here are a few challenges, and they are not isolated to the hospitality industry.

  • Failed Implementations: Some hotels have abandoned chatbots due to poor user experiences when systems couldn’t handle complex queries.
  • Bias in AI Systems: Recommendation engines risk unintentionally favoring certain vendors or property types, creating fairness and trust issues.
  • Data Privacy Concerns: Collecting and analyzing guest data for personalization raises regulatory and ethical concerns, especially under GDPR and CCPA.
  • High Implementation Costs: Smaller operators often struggle with the initial investment required for advanced AI systems.
  • Overreliance on Automation: Excessive use of AI can diminish the “human touch” that many guests still value.

The Future of AI in Hospitality

The next phase of AI in hospitality is likely to include:

  • Hyper-Personalization: AI systems will go beyond booking preferences to tailor entire experiences—from menu suggestions to curated itineraries.
  • Generative AI: Personalized travel content (itineraries, local recommendations, even promotional materials) will increasingly be AI-generated.
  • Seamless Multimodal Interfaces: Guests will interact with hotels through integrated combinations of text, voice, and even gesture recognition.
  • Sustainability Optimization: AI will be used to minimize energy consumption and waste, appealing to environmentally conscious travelers.
  • Immersive Experiences: Integration of AI with augmented reality (AR) and virtual reality (VR) to offer “preview stays” or guided tours before booking.

How Hospitality Companies Can Gain an Advantage

To thrive in this rapidly evolving AI landscape, hospitality businesses should:

  1. Start Small, Scale Fast: Pilot AI tools (e.g., chatbots, predictive analytics) in controlled settings before rolling them out property-wide.
  2. Invest in Data Infrastructure: High-quality, integrated data systems are essential for effective AI.
  3. Balance AI with Human Service: Use AI to enhance—not replace—the human element that defines hospitality.
  4. Prioritize Ethical AI: Ensure AI systems are transparent, unbiased, and compliant with privacy regulations.
  5. Foster a Culture of Innovation: Train staff to work alongside AI tools, and encourage adoption through upskilling and change management.
  6. Partner Strategically: Collaborate with AI technology providers, startups, and academic institutions to stay ahead of the curve.

Conclusion

AI is not just a tool for the hospitality industry—it’s a catalyst for reimagining the guest journey and the operational efficiency. While challenges exist, companies that harness AI responsibly and strategically stand to unlock new levels of personalization, efficiency, and growth. Those who hesitate may find themselves outpaced by competitors who use AI to transform service from reactive to predictive, and from transactional to truly memorable. And its adoption and effectiveness are expected to continue to grow with an estimated 60% to 70% of hotels, travel agencies, and short-term rentals planning to adopt or expand their use of AI.

As mentioned earlier, this article is one of a series of many articles that share information on AI in various industries and business functions. Be on the lookout for the future articles in the series. Thanks for reading! Good luck on your data journey!

The 5th type of analytics – cognitive analytics

Sometime ago, I wrote an article titled “What is data analytics? And what are the different types of data analytics?”. In that post, I described four types of analytics:

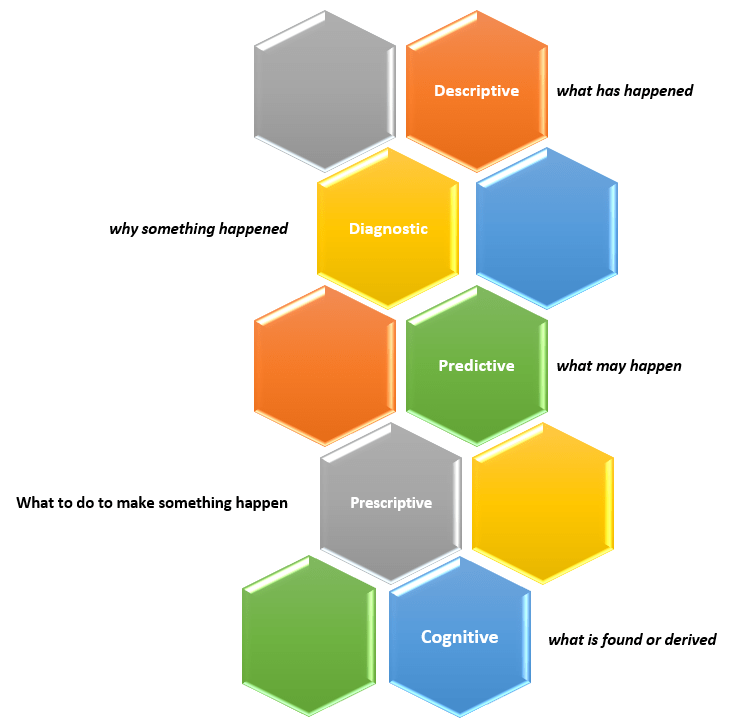
  • Descriptive Analytics – what has happened?
  • Diagnostic Analytics – why something happened?
  • Predictive Analytics – what may happen (in the future)?
  • Prescriptive Analytics – what to do to make something happen?

You can read that full article here.

New capabilities and solutions have led to a new classification of analytics called Cognitive Analytics.

Cognitive Analytics involves bringing together technologies such as Artificial Intelligence (AI), Machine Learning (ML), and Deep Learning to apply human-like behavior to data tasks at unhuman scale, such as, searching through massive amounts of data and making sense of its contexts and be able to provide information from it, such as a likely answer or a sentiment score. This form of analytics provides new solutions that do not fit into any of the other four classifications and, in short, can be dubbed as “what is found or derived“.

There are many use cases that could benefit from this type of analytics, such as, personalization of services at scale, and improved customer service efficiency.

Thanks for reading and best wishes on your data journey!