
As we close out 2025, it’s clear that the global data landscape has continued its unprecedented expansion — touching every part of life, business, and technology. From raw bytes generated every second to the ways that AI reshapes how we search, communicate, and innovate, this year has marked another seismic leap forward for data. Below is a comprehensive look at where we stand — and where things appear to be headed as we approach 2026.
🌐 Global Data Generation: A Tidal Wave
Amount of Data Generated
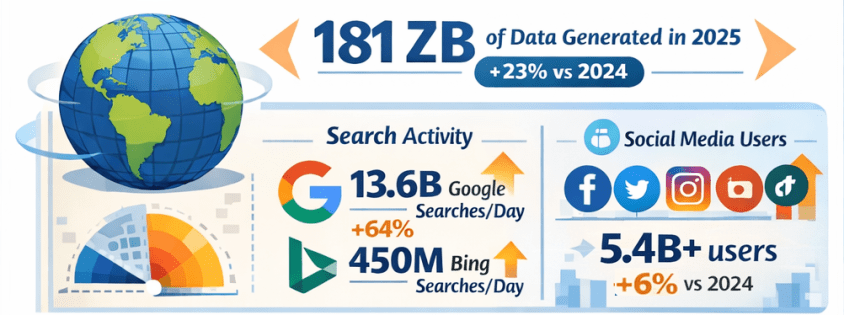
- In 2025, the total volume of data created, captured, copied, and consumed globally is forecast to reach approximately 181 zettabytes (ZB) — up from about 147 ZB in 2024, representing roughly 23% year-over-year growth. Gitnux+1
- That equates to an astonishing ~402 million terabytes of data generated daily. Exploding Topics
Growth Comparison: 2024 vs 2025
- Data is growing at a compound rate: from roughly 120 ZB in 2023 to 147 ZB in 2024, then to about 181 ZB in 2025 — illustrating an ongoing surge of data creation driven by digital adoption and connected devices. Exploding Topics+1
🔍 Internet Users & Search Behavior
Number of People Online
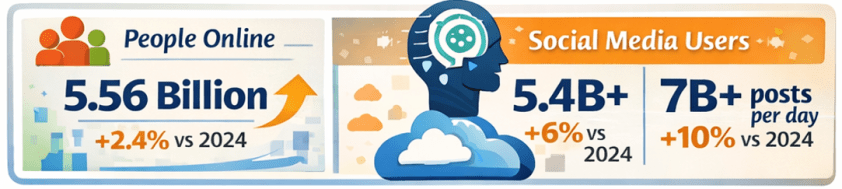
- As of early 2025, around 5.56 billion people are active internet users, accounting for nearly 68% of the global population — up from approximately 5.43 billion in 2024. DemandSage
Search Engine Activity
- Google alone handles roughly 13.6 billion searches per day in 2025, totaling almost 5 trillion searches annually — a significant increase from the estimated 8.3 billion daily searches in 2024. Exploding Topics
- Bing, while much smaller in scale, processes around 450+ million searches per day (~13–14 billion per month). Nerdynav
Market Share Snapshot
- Google continues to dominate search with approximately 90% global market share, while Bing remains one of the top alternatives. StatCounter Global Stats
📱 Social Media Usage & Content Creation
User Numbers
- There are roughly 5.4–5.45 billion social media users worldwide in 2025 — up from prior years and covering about 65–67% of the global population. XtendedView+1
Time Spent & Trends
- Users spend on average about 2 hours and 20+ minutes per day on social platforms. SQ Magazine
- AI plays a central role in content recommendations and creation, with 80%+ of social feeds relying on algorithms, and an increasing share of generated images and posts assisted by AI tools. SQ Magazine
📊 The Explosion of AI: LLMs & Tools
LLM Adoption
- Large language models and AI assistants like ChatGPT have become globally pervasive:
- ChatGPT alone has around 800 million weekly active users as of late 2025. First Page Sage
- Daily usage figures exceed 2.5 billion user prompts globally, highlighting a massive shift toward direct AI interaction. Exploding Topics
- Studies have shown that LLM-assisted writing and content creation are now embedded across formal and informal communication channels, indicating broad adoption beyond curiosity use cases. arXiv
AI Tools Everywhere
- Generative AI is now a staple across industries — from content creation to customer service, data analytics to software development. Investments and usage in AI-powered analytics and automation tools continue to rise rapidly. layerai.org

💡 Trends in Data Collection & Analytics
Real-Time & Edge Processing
- In 2025, more than half of corporate data processing is happening at the edge, closer to the source of data generation, enabling real-time insights. Pennsylvania Institute of Technology
Data Democratization
- Data access and analytics tools have become more user-friendly, with low-code/no-code platforms enabling broader organizational participation in data insight generation. postlo.com
☁️ Cloud & Data Infrastructure
Cloud Data Growth
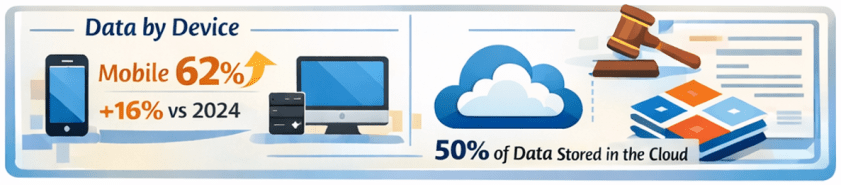
- An ever-increasing portion of global data is stored in the cloud, with estimates suggesting around half of all data resides in cloud environments by 2025. Axis Intelligence
Data Centers & Energy
- Data centers, particularly those supporting AI workloads, are expanding rapidly. This infrastructure surge is driving both innovation and concerns — including power consumption and sustainability challenges. TIME
📜 Data Laws & Regulation
New Legal Frameworks
- In the UK, the Data (Use and Access) Act of 2025 was enacted, updating data protection and access rules related to UK-specific GDPR implementations. Wikipedia
- Elsewhere, data regulation remains a focal point globally, with ongoing debates around privacy, governance, AI accountability, and cross–border data flows.
🛠️ Top Data Tools/Platforms of 2025
While specific rankings vary by industry and use case, 2025’s data ecosystem centers around:
- Cloud data platforms: Snowflake, BigQuery, Redshift, Databricks
- BI & visualization: Tableau, Power BI
- AI/ML frameworks: TensorFlow, PyTorch, scalable LLM platforms
- Automation & low-code analytics: dbt, Airflow, no-code toolchains
- Real-time streaming: Kafka, ksqlDB
Ongoing trends emphasize integration between AI tooling and traditional analytics pipelines — blurring the lines between data engineering, analytics, and automation.
Note: specific tool adoption percentages vary by firm size and sector, but cloud-native and AI-augmented tools dominate enterprise workflows. Reddit
🌟 Novel Uses of Data in 2025
2025 saw innovative applications such as:
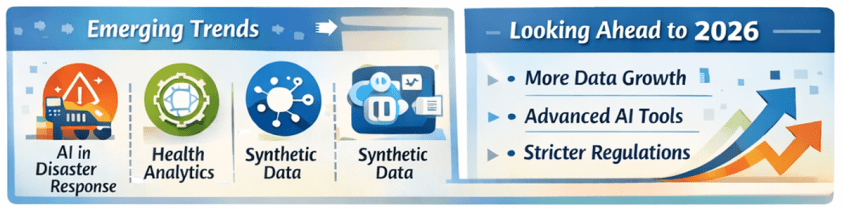
- AI-powered disaster response using real-time social data streams.
- Conversational assistants embedded into everyday workflows (search, writing, decision support).
- Predictive analytics in health, finance, logistics, accelerated by real-time IoT feeds.
- Synthetic datasets for simulation, security research, and model training. arXiv
🔮 What’s Expected in 2026
Continued Growth
- Data volumes are projected to keep rising — potentially doubling every few years with the proliferation of AI, IoT, and immersive technologies.
- LLM adoption will likely hit deeper integration into enterprise processes, customer experience workflows, and consumer tech.
- AI governance and data privacy regulation will intensify globally, balancing innovation with accountability.
Emerging Frontiers
- Multimodal AI blending text, vision, and real-time sensor data.
- Federated learning and privacy-preserving analytics gaining traction.
- Data meshes and decentralized data infrastructures challenging traditional monolithic systems.
- Unified data platforms with AI-focused features and AI-focused business-ready data models are becoming common place.
📌 Final Thoughts
2025 has been another banner year for data — not just in sheer scale, but in how data powers decision-making, AI capabilities, and digital interactions across society. From trillions of searches to billions of social interactions, from zettabytes of oceans of data to democratized analytics tools, the data world continues to evolve at breakneck speed. And for data professionals and leaders, the next year promises even more opportunities to harness data for insight, innovation, and impact. Exciting stuff!
Thanks for reading!


